Essay
The following table shows the prices (in $1,000s)of the last 15 trucks sold at a Toyota dealership. 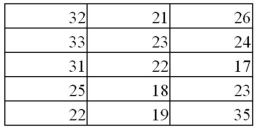 Construct a stem-and-leaf diagram.Given this diagram,estimate the price that a potential buyer would likely pay for a Toyota truck.
Correct Answer:

Verified
Correct Answer:
Verified
Related Questions
Q2: Construct a stem-and-leaf diagram for the following
Q3: The following table displays the top 40
Q5: In order to summarize qualitative data,a useful
Q6: Exhibit 2-8.Consider the following frequency distribution. <img
Q7: Exhibit 2-1.An auto parts chain asked customers
Q8: A hair stylist records the hair color
Q11: Each month the Bureau of Labor Statistics
Q27: A histogram is a series of rectangles
Q75: A stem-and-leaf diagram is useful in that
Q123: Which of the following best describes a