Multiple Choice
The following stem-and-leaf diagram shows the last 20 dividend payments (in cents) paid by Proctor and Gamble. 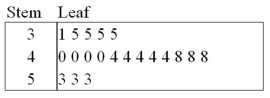 The most common dividend payment is ____.
A) 0.35
B) 0.40
C) 0.44
D) 0.48
Correct Answer:

Verified
Correct Answer:
Verified
Related Questions
Q18: For both qualitative and quantitative data, what
Q69: The following data represent the ages of
Q70: Johnson and Johnson (JNJ)is a consumer staples
Q72: The dividend yields of the stocks in
Q75: Exhibit 2-10.Automobiles traveling on a road with
Q76: Exhibit 2-9.An analyst constructed the following frequency
Q78: Exhibit 2-7.Thirty students at Eastside High School
Q84: How does an ogive differ from a
Q90: For quantitative data, a cumulative relative frequency
Q107: The relative frequency of a category is