Multiple Choice
Exhibit 2-10.Automobiles traveling on a road with a posted speed limit of 65 miles per hour are checked for speed by a state police radar system.The following table is a frequency distribution of speeds. 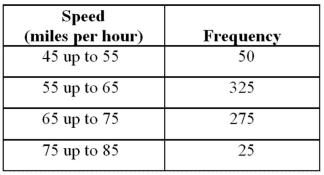 Refer to Exhibit 2-10.How many of the cars traveled less than 75 miles per hour?
A) 275
B) 325
C) 650
D) 675
Correct Answer:

Verified
Correct Answer:
Verified
Q18: For both qualitative and quantitative data, what
Q70: Johnson and Johnson (JNJ)is a consumer staples
Q72: The dividend yields of the stocks in
Q74: The following stem-and-leaf diagram shows the last
Q76: Exhibit 2-9.An analyst constructed the following frequency
Q78: Exhibit 2-7.Thirty students at Eastside High School
Q80: Exhibit 2-6.The following data represent the recent
Q84: How does an ogive differ from a
Q90: For quantitative data, a cumulative relative frequency
Q107: The relative frequency of a category is