Multiple Choice
Exhibit 2-9.An analyst constructed the following frequency distribution on the monthly returns for 50 selected stocks: 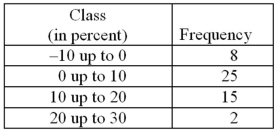 Refer to Exhibit 2-9.The proportion of stocks with returns of less than 10% is ____.
A) 0.30
B) 0.50
C) 0.66
D) 0.80
Correct Answer:

Verified
Correct Answer:
Verified
Q18: For both qualitative and quantitative data, what
Q72: The dividend yields of the stocks in
Q74: The following stem-and-leaf diagram shows the last
Q75: Exhibit 2-10.Automobiles traveling on a road with
Q78: Exhibit 2-7.Thirty students at Eastside High School
Q80: Exhibit 2-6.The following data represent the recent
Q81: The accompanying table shows students' scores from
Q84: How does an ogive differ from a
Q90: For quantitative data, a cumulative relative frequency
Q107: The relative frequency of a category is