Multiple Choice
The following graphic of PCB Failures is a _____________. 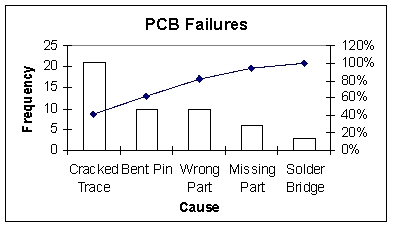
A) Scatter Plot
B) Pareto Chart
C) Pie Chart
D) Cumulative Histogram Chart
E) Line diagram
Correct Answer:

Verified
Correct Answer:
Verified
Related Questions
Q19: A histogram can be described as a
Q24: The following is a bar chart of
Q25: The 2010 and 2012 market share data
Q27: The staff of Mr.Wayne Wertz,VP of Operations
Q31: The United Nations Development Programme website provides
Q32: A recent survey of U.S.automobile owners showed
Q34: The 2010 and 2012 market share data
Q46: In contrast to quantitative data graphs that
Q72: A scatter plot is useful for examining
Q89: An instructor made a frequency table