Essay
A large automobile parts supplier keeps track of the demand for a particular part needed by its customers, automobile manufacturers. The time series plot below shows monthly demand for this part (in thousands) for a five year period. 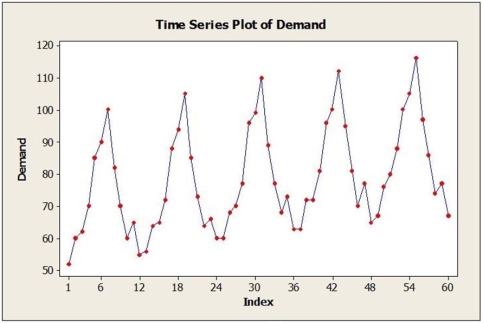 a. Identify the dominant time series component(s) in the data.
b. Suppose that the single exponential smoothing (SES) model was applied to these data. Below are time series graphs showing SES results using two different smoothing constants (α = 0.2 and α = 0.8). In which application is a larger value of α used?
i. 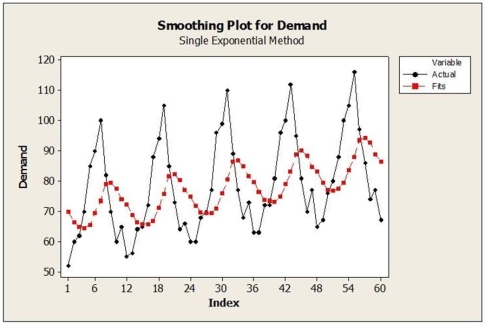 ii.
ii. 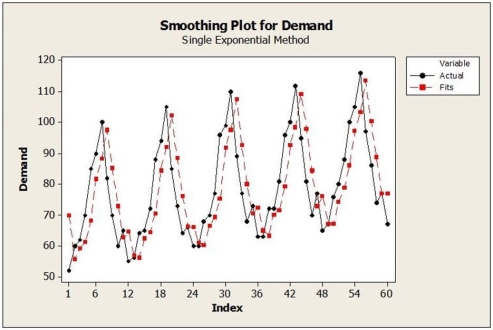 c. What forecasting method may be a better choice than SES for these data? Explain.
Correct Answer:

Verified
a. Seasonal and trend components
b. A cu...View Answer
Unlock this answer now
Get Access to more Verified Answers free of charge
Correct Answer:
Verified
b. A cu...
View Answer
Unlock this answer now
Get Access to more Verified Answers free of charge
Q9: Consider the following to answer the question(s)
Q10: Consider the following to answer the question(s)
Q11: Monthly closing stock prices, adjusted for dividends,
Q12: Consider the following to answer the question(s)
Q13: The MSE for the forecasting method used
Q15: Quarterly sales data (in $10,000) for a
Q16: Consider the following to answer the question(s)
Q17: Consider the following to answer the question(s)
Q18: Consider the following to answer the question(s)
Q19: Which of the following statement is true