Multiple Choice
Consider the graph of f(t) . 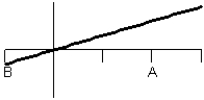 What does the graph of the accumulation function
  look like?
A) 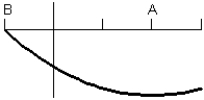
B) 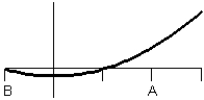
C) 
D) 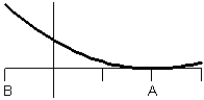
E) 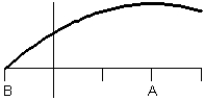
Correct Answer:

Verified
Correct Answer:
Verified
Related Questions
Q9: A program to protect a species of
Q10: The graph of <img src="https://d2lvgg3v3hfg70.cloudfront.net/TB6775/.jpg" alt="The graph
Q11: Scientists can model the change in snow
Q12: The rate of change of the weight
Q13: Find the specific antiderivative of <img src="https://d2lvgg3v3hfg70.cloudfront.net/TB6775/.jpg"
Q15: Consider the graph of r(t), the rate
Q16: The acceleration of a race car during
Q17: The cost of producing x units of
Q18: Suppose the population of a country between
Q19: Find the area of the shaded region.