Multiple Choice
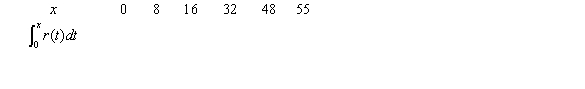
Consider the graph of r(t) , the rate of change in the price of a technology stock, during the first 55 days of trading of 2003. Using the information present below, fill in the accumulation function values in the accompanying table. 

A) 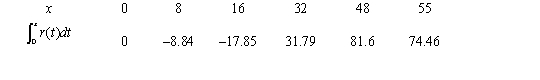
B) 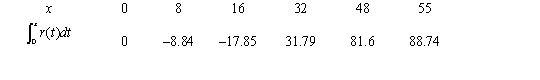
C) 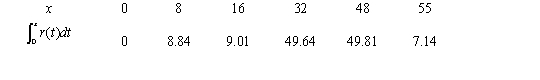
D) 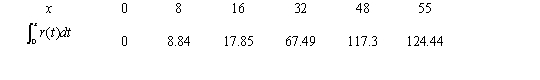
E) 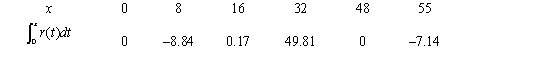
Correct Answer:

Verified
Correct Answer:
Verified
Q10: The graph of <img src="https://d2lvgg3v3hfg70.cloudfront.net/TB6775/.jpg" alt="The graph
Q11: Scientists can model the change in snow
Q12: The rate of change of the weight
Q13: Find the specific antiderivative of <img src="https://d2lvgg3v3hfg70.cloudfront.net/TB6775/.jpg"
Q14: Consider the graph of f(t). <img src="https://d2lvgg3v3hfg70.cloudfront.net/TB6775/.jpg"
Q16: The acceleration of a race car during
Q17: The cost of producing x units of
Q18: Suppose the population of a country between
Q19: Find the area of the shaded region.
Q20: Consider the graph of f(t). <img src="https://d2lvgg3v3hfg70.cloudfront.net/TB6775/.jpg"