Essay
The graph of a function f is given below. Estimate using 4 subintervals with sample points: 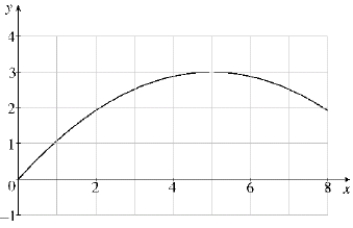 (a) right endpoints.(b) left endpoints.(c) midpoints.
Correct Answer:

Verified
Correct Answer:
Verified
Related Questions
Q189: Find the value of the integral
Q190: (a) If <span class="ql-formula" data-value="f
Q191: A scientist collects the following data
Q192: Use right endpoints with n =
Q193: Find the value of the integral
Q195: Express <span class="ql-formula" data-value="\lim _
Q196: Evaluate the improper integral <span
Q197: Evaluate <span class="ql-formula" data-value="\int \frac
Q198: Find the value of the integral
Q199: Evaluate the integral <span class="ql-formula"