Multiple Choice
Which of the following graphs best depicts the entropy of a pure substance as the temperature is raised from its solid form through its liquid and gaseous forms?
A) 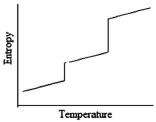
B) 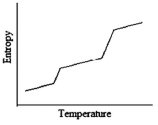
C) 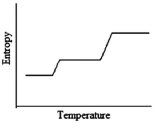
D) 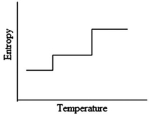
Correct Answer:

Verified
Correct Answer:
Verified
Q111: A sketch of the free energy for
Q112: Determine <font face="symbol"></font><font face="symbol"></font> <img src="https://d2lvgg3v3hfg70.cloudfront.net/TB3835/.jpg" alt="Determine
Q113: What is the entropy change if 4.500
Q114: For a particular hypothetical reaction, <img src="https://d2lvgg3v3hfg70.cloudfront.net/TB3835/.jpg"
Q115: Which of the following must be true
Q117: Which of the following will have the
Q118: Consider substances that exist as liquids under
Q119: When a solution of DNA in water
Q120: Which of the following must be true
Q121: When plotting ln K vs. 1/T, a