Multiple Choice
Which of the following figures illustrates best the sequence of the free-energy values (shown with the star) for a chemical reaction at equilibrium to the removal of products, followed by the response of the equilibrium to this stress?
A) 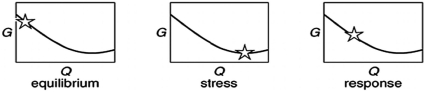
B) 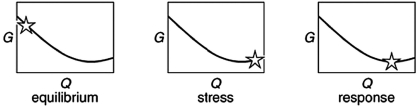
C) 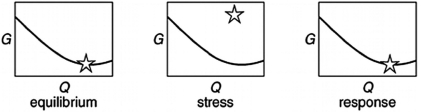
D) 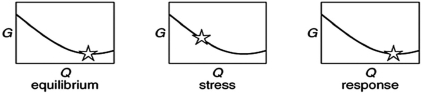
Correct Answer:

Verified
Correct Answer:
Verified
Related Questions
Q85: Given the following data relevant to the
Q86: Give an example of a spontaneous and
Q87: The dissolution of ammonium nitrate in water
Q88: If for a given chemical reaction at
Q89: Draw a graph of entropy versus temperature
Q91: Nitrogen monoxide molecules can react to form
Q92: Some pure metals can be obtained from
Q93: Which of the listed perturbations would change
Q94: What is a microstate and how are
Q95: Indicate which of the following has the