Short Answer
Using the data shown below for water, determine in the following heating curve what region the water will be in when 50 g of ice at 25C is provided with 35 kJ of energy. 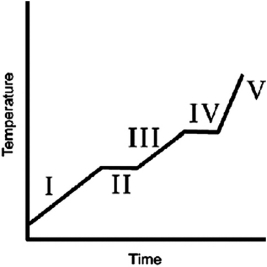 Boiling point
373 K
Melting point
273 K
Enthalpy of vaporization
2,260 J/g
Enthalpy of fusion
334 J/g
Specific heat capacity (solid)
2.11 J/(g K)
Specific heat capacity (liquid)
4.18 J/(g K)
Specific heat capacity (gas)
2.08 J/(g K)
Correct Answer:

Verified
Correct Answer:
Verified
Q129: Which statement A-D about a system and
Q130: Use the following information to determine the
Q131: For which reaction below does the enthalpy
Q132: Which of the following fuels has the
Q133: Steam in a cylinder is compressed by
Q135: To cool your 250 mL of coffee
Q136: Determine the standard enthalpy of formation for
Q137: Napthalene is often used to determine the
Q138: State the first law of thermodynamics. Describe
Q139: During a(n) _ process, energy is transferred