Multiple Choice
The following Excel scatterplot with the fitted quadratic regression equation illustrates the observed relationship between productivity and the number of hired workers. 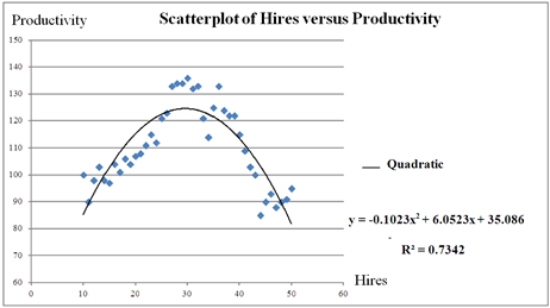 Assuming that the values of Hires can be nonintegers,what is the maximum value of Productivity?
A) 29.58
B) 124.603
C) 35.086
D) 127.50
Correct Answer:

Verified
Correct Answer:
Verified
Q28: A quadratic regression model is a special
Q29: The quadratic and logarithmic models,y = β<sub>0</sub>
Q30: For the log-log model ln(y)= β<sub>0</sub> +
Q31: Typically,the sales volume declines with an increase
Q32: The fit of the models y =
Q34: Thirty employed single individuals were randomly selected
Q35: The log-log and exponential models,ln(x)= β<sub>0</sub> +
Q36: The following data,with the corresponding Excel scatterplot,show
Q37: The following Excel scatterplot with the fitted
Q38: The following data,with the corresponding Excel scatterplot,show