Multiple Choice
The following data,with the corresponding Excel scatterplot,show the average growth rate of Weeping Higan cherry trees planted in Washington,DC.At the time of planting,the trees were one year old and were all six feet in height. 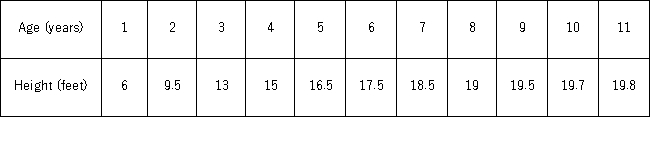
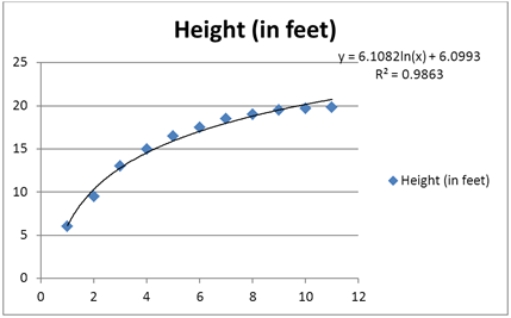 The 98.63% of the variations in Height is explained by _______.
A) Height
B) Age
C) ln(Age)
D) ln(Height)
Correct Answer:

Verified
Correct Answer:
Verified
Q33: The following Excel scatterplot with the fitted
Q34: Thirty employed single individuals were randomly selected
Q35: The log-log and exponential models,ln(x)= β<sub>0</sub> +
Q36: The following data,with the corresponding Excel scatterplot,show
Q37: The following Excel scatterplot with the fitted
Q40: Thirty employed single individuals were randomly selected
Q41: For the logarithmic model ln(y)= β<sub>0</sub> +
Q42: It is believed that the sales volume
Q43: Thirty employed single individuals were randomly selected
Q98: Which of the following nonlinear regression models