Multiple Choice
The following Excel scatterplot with the fitted quadratic regression equation illustrates the observed relationship between productivity and the number of hired workers. 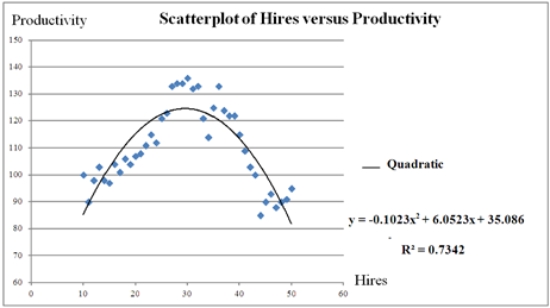 Assuming that the number of hired workers must be integer,how many workers should be hired to achieve the highest productivity?
A) 26
B) 28
C) 30
D) 32
Correct Answer:

Verified
Correct Answer:
Verified
Q32: The fit of the models y =
Q33: The following Excel scatterplot with the fitted
Q34: Thirty employed single individuals were randomly selected
Q35: The log-log and exponential models,ln(x)= β<sub>0</sub> +
Q36: The following data,with the corresponding Excel scatterplot,show
Q38: The following data,with the corresponding Excel scatterplot,show
Q40: Thirty employed single individuals were randomly selected
Q41: For the logarithmic model ln(y)= β<sub>0</sub> +
Q42: It is believed that the sales volume
Q98: Which of the following nonlinear regression models