Essay
Thirty employed single individuals were randomly selected to examine the relationship between their age (Age)and their credit card debt (Debt)expressed as a percentage of their annual income.Three polynomial models were applied and the following table summarizes Excel's regression results. 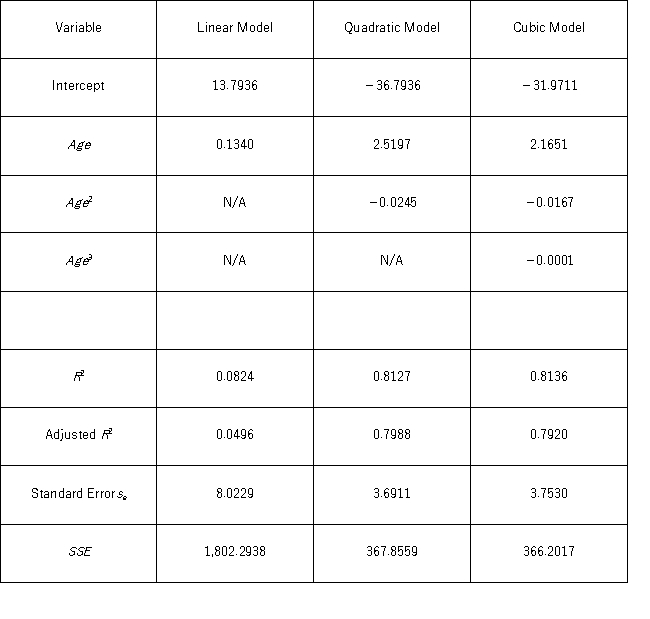 What is the percentage of variations in Debt explained by Age in the regression equation with the best fit?
Correct Answer:

Verified
Because the linear,quadratic,and cubic m...View Answer
Unlock this answer now
Get Access to more Verified Answers free of charge
Correct Answer:
Verified
View Answer
Unlock this answer now
Get Access to more Verified Answers free of charge
Q35: The log-log and exponential models,ln(x)= β<sub>0</sub> +
Q36: The following data,with the corresponding Excel scatterplot,show
Q37: The following Excel scatterplot with the fitted
Q38: The following data,with the corresponding Excel scatterplot,show
Q41: For the logarithmic model ln(y)= β<sub>0</sub> +
Q42: It is believed that the sales volume
Q43: Thirty employed single individuals were randomly selected
Q44: The following data show the demand for
Q45: It is believed that the sales volume
Q98: Which of the following nonlinear regression models