Multiple Choice
Students in Professor Smith's business statistics course have evaluated the overall effectiveness of the professor's instruction on a five-point scale,where a score of 1 indicates very poor performance and a score of 5 indicates outstanding performance.The raw scores are displayed in the accompanying table. 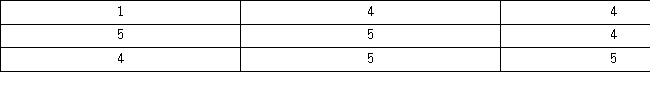 What percentage of students gave Professor Smith an evaluation of 2 or less?
A) 6.7%
B) 13.3%
C) 20%
D) 80%
Correct Answer:

Verified
Correct Answer:
Verified
Q42: A bar chart may be displayed horizontally.
Q59: What may be revealed from a scatterplot?<br>A)
Q62: For quantitative data, a relative frequency distribution
Q86: The accompanying relative frequency distribution represents the
Q87: In the accompanying stem-and-leaf diagram,the values in
Q88: The following table shows analyst sentiment ratings
Q90: Consider the following frequency distribution. <img src="https://d2lvgg3v3hfg70.cloudfront.net/TB4266/.jpg"
Q93: In the following pie chart representing a
Q96: A city in California spent $6 million
Q97: When constructing a frequency distribution for quantitative