Multiple Choice
A city in California spent $6 million repairing damage to its public buildings in 2010.The following table shows the categories where the money was directed. 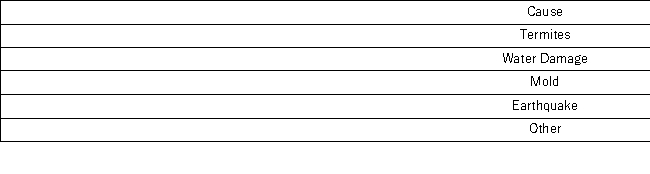 How much more did the city spend to fix damage caused by termites compared to the damage caused by water?
A) $360,000
B) $720,000
C) $960,000
D) $1,320,000
Correct Answer:

Verified
Correct Answer:
Verified
Q86: When constructing a pie chart, only a
Q109: Thirty students at Eastside High School took
Q110: T <img src="https://d2lvgg3v3hfg70.cloudfront.net/TB4266/.jpg" alt="T Using
Q111: Consider the following stem-and-leaf diagram. <img src="https://d2lvgg3v3hfg70.cloudfront.net/TB4266/.jpg"
Q113: In the accompanying stem-and-leaf diagram,the values in
Q116: The following data represent scores on a
Q117: The accompanying relative frequency distribution represents the
Q118: The following data represent scores on a
Q119: An analyst constructed the following frequency distribution
Q120: Frequency distributions may be used to describe