menu-iconExamlexExamLexServices

Discover

Ask a Question
  1. All Topics
  2. Topic
    Statistics
  3. Study Set
    Business Statistics Communicating with Numbers Study Set 2
  4. Exam
    Exam 2: Tabular and Graphical Methods
  5. Question
    The Following Data Represent Scores on a Pop Quiz in a Statistics
Solved

The Following Data Represent Scores on a Pop Quiz in a Statistics

Question 118

Question 118

Multiple Choice

The following data represent scores on a pop quiz in a statistics section: The following data represent scores on a pop quiz in a statistics section:   Suppose the data are grouped into five classes,and one of them will be  30 up to 44.  that is,{x;30 ≤ x < 44}.The frequency of this class is _____. A)  0.20 B)  0.25 C)  4 D)  5 
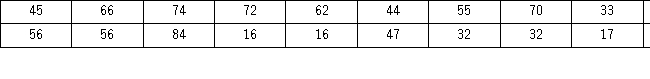
Suppose the data are grouped into five classes,and one of them will be "30 up to 44." that is,{x;30 ≤ x < 44}.The frequency of this class is _____.


A) 0.20
B) 0.25
C) 4
D) 5

Correct Answer:

verifed

Verified

Unlock this answer now
Get Access to more Verified Answers free of charge

Related Questions

Q9: A scatterplot is a graphical tool that

Q109: The shape of most data distributions can

Q113: In the accompanying stem-and-leaf diagram,the values in

Q114: A city in California spent $6 million

Q116: The following data represent scores on a

Q117: The accompanying relative frequency distribution represents the

Q119: An analyst constructed the following frequency distribution

Q120: Frequency distributions may be used to describe

Q120: The following data represent the recent sales

Q122: Automobiles traveling on a road with a

Examlex

ExamLex

About UsContact UsPerks CenterHomeschoolingTest Prep

Work With Us

Campus RepresentativeInfluencers

Links

FaqPricingChrome Extension

Download The App

Get App StoreGet Google Play

Policies

Privacy PolicyTerms of ServiceHonor CodeCommunity Guidelines

Scan To Download

qr-code

Copyright © (2025) ExamLex LLC.

Privacy PolicyTerms Of ServiceHonor CodeCommunity Guidelines