Essay
T 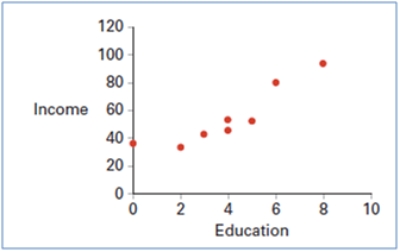 Using a scatterplot above we observe a _________ linear relationship between two variables: Education and Income.
Correct Answer:

Verified
Correct Answer:
Verified
Related Questions
Q23: What graphical tool is best used to
Q60: When constructing a frequency distribution for quantitative
Q86: When constructing a pie chart, only a
Q107: The statistics professor has kept attendance records
Q108: The following frequency distribution shows the frequency
Q109: Thirty students at Eastside High School took
Q111: Consider the following stem-and-leaf diagram. <img src="https://d2lvgg3v3hfg70.cloudfront.net/TB4266/.jpg"
Q113: In the accompanying stem-and-leaf diagram,the values in
Q114: A city in California spent $6 million
Q120: Frequency distributions may be used to describe