Multiple Choice
The following data represent scores on a pop quiz in a statistics section. 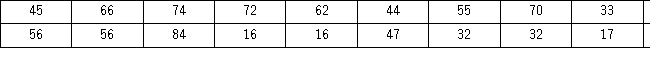 Suppose the data are grouped into five classes,and one of them will be "30 up to 44" -that is,{x;30 ≤ x < 44}.The relative frequency of this class is _____.
A) 0.20
B) 0.25
C) 4
D) 5
Correct Answer:

Verified
Correct Answer:
Verified
Q9: A scatterplot is a graphical tool that
Q86: When constructing a pie chart, only a
Q111: Consider the following stem-and-leaf diagram. <img src="https://d2lvgg3v3hfg70.cloudfront.net/TB4266/.jpg"
Q113: In the accompanying stem-and-leaf diagram,the values in
Q114: A city in California spent $6 million
Q117: The accompanying relative frequency distribution represents the
Q118: The following data represent scores on a
Q119: An analyst constructed the following frequency distribution
Q120: Frequency distributions may be used to describe
Q120: The following data represent the recent sales