Multiple Choice
The following data represent the recent sales price (in $1,000s) of 24 homes in a Midwestern city. 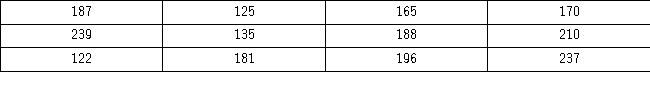 Suppose the data on house prices will be grouped into five classes.The width of the classes for a frequency distribution or histogram is the closest to _______.
A) 15
B) 20
C) 25
D) 30
Correct Answer:

Verified
Correct Answer:
Verified
Q9: A scatterplot is a graphical tool that
Q109: The shape of most data distributions can
Q113: In the accompanying stem-and-leaf diagram,the values in
Q114: A city in California spent $6 million
Q116: The following data represent scores on a
Q117: The accompanying relative frequency distribution represents the
Q118: The following data represent scores on a
Q119: An analyst constructed the following frequency distribution
Q120: Frequency distributions may be used to describe
Q122: Automobiles traveling on a road with a