Multiple Choice
Parts manufactured by an injection molding process are subjected to a compressive strength test.We wish to monitor the compressive strength of the parts manufactured by this process using both  and s charts.Samples of size 9 are to be taken at regular intervals,and their mean compressive strength (in psi = pounds per square inch) and standard deviation are plotted on the charts in time order.The target values for the compressive strengths are a mean of = 80 psi and a standard deviation of = 3 psi.The control chart constants are (partially) reproduced below.
 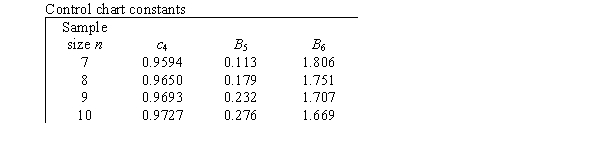 What is the center line for the
Chart?
A) 3 psi
B) 77 psi
C) 80 psi
D) None of the above
Correct Answer:

Verified
Correct Answer:
Verified
Q7: Suppose you want to determine if offering
Q8: Which of the following is an example
Q9: When a process variable is Normally distributed,there
Q10: Parts manufactured by an injection molding process
Q11: The data below represent the means from
Q13: Which of the following statements about special
Q14: Piston rings for an automotive engine are
Q15: Statistical stability means there is no variation
Q16: What do control limits show?<br>A)The exact value
Q17: Which rule will typically signal an out-of-control