Multiple Choice
The data below represent the means from 15 sample control charts for the amount of time in minutes it takes students to complete a quiz in a basic statistics course.The same quiz was given to 15 different sections of a basic statistics course.Five students were sampled from each class and each mean is shown below. 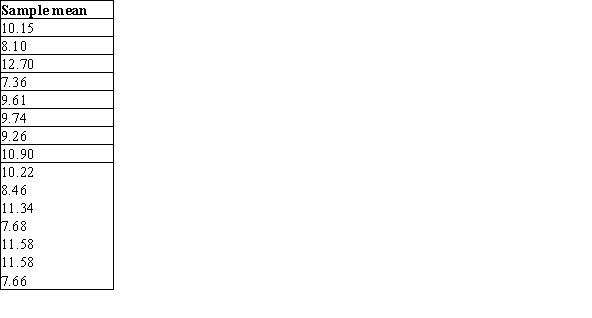 What is the approximate value of the center line for the correct control chart?
A) 16.71
B) 2.83
C) 9.77
D) None of the above
Correct Answer:

Verified
Correct Answer:
Verified
Q6: Piston rings for an automotive engine are
Q7: Suppose you want to determine if offering
Q8: Which of the following is an example
Q9: When a process variable is Normally distributed,there
Q10: Parts manufactured by an injection molding process
Q12: Parts manufactured by an injection molding process
Q13: Which of the following statements about special
Q14: Piston rings for an automotive engine are
Q15: Statistical stability means there is no variation
Q16: What do control limits show?<br>A)The exact value