Multiple Choice
Parts manufactured by an injection molding process are subjected to a compressive strength test.We wish to monitor the compressive strength of the parts manufactured by this process using both  and s charts.Samples of size 9 are to be taken at regular intervals,and their mean compressive strength (in psi = pounds per square inch) and standard deviation are plotted on the charts in time order.The target values for the compressive strengths are a mean of = 80 psi and a standard deviation of = 3 psi.The control chart constants are (partially) reproduced below.
 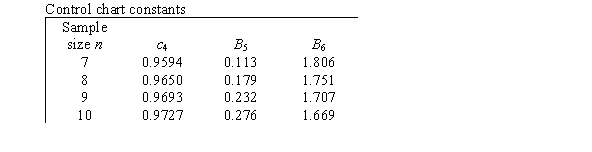 What is the lower control limit for the
Chart?
A) 71 psi
B) 77 psi
C) 83 psi
D) 89 psi
Correct Answer:

Verified
Correct Answer:
Verified
Q5: An automobile dealer checks on the quality
Q6: Piston rings for an automotive engine are
Q7: Suppose you want to determine if offering
Q8: Which of the following is an example
Q9: When a process variable is Normally distributed,there
Q11: The data below represent the means from
Q12: Parts manufactured by an injection molding process
Q13: Which of the following statements about special
Q14: Piston rings for an automotive engine are
Q15: Statistical stability means there is no variation