Multiple Choice
Refer to the following figure when answering the following questions.
Figure 16.4: Personal Saving Rate: 1990-2010 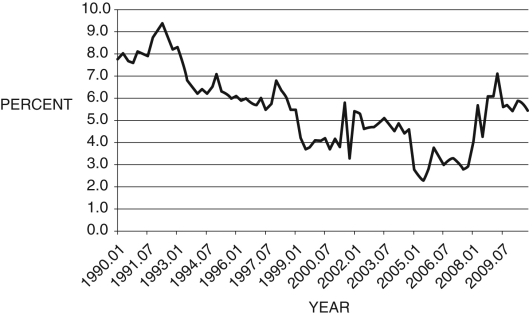
-Consider Figure 16.4. A possible cause for the fall in the saving rate between 1990 and 2005 is:
A) precautionary saving.
B) consumption smoothing.
C) the changing composition of households' savings portfolios.
D) increasing competition among commercial banks.
E) less access to credit markets.
Correct Answer:

Verified
Correct Answer:
Verified
Q1: In the text, <img src="https://d2lvgg3v3hfg70.cloudfront.net/TB6622/.jpg" alt="In the
Q2: To analyze Ricardian equivalence using the neoclassical
Q3: An implication of Figure 16.2 is that
Q4: In 1992, the first Bush administration was
Q5: The equation <img src="https://d2lvgg3v3hfg70.cloudfront.net/TB6622/.jpg" alt="The equation
Q7: Figure 16.8: Personal Savings Rates <img src="https://d2lvgg3v3hfg70.cloudfront.net/TB6622/.jpg"
Q8: Your lifetime utility is a function of:<br>A)
Q9: Consider Figure 16.7 below, which shows the
Q10: Consider consumption in two periods, <img src="https://d2lvgg3v3hfg70.cloudfront.net/TB6622/.jpg"
Q11: If <span class="ql-formula" data-value="\beta"><span class="katex"><span