Essay
Figure 16.8: Personal Savings Rates 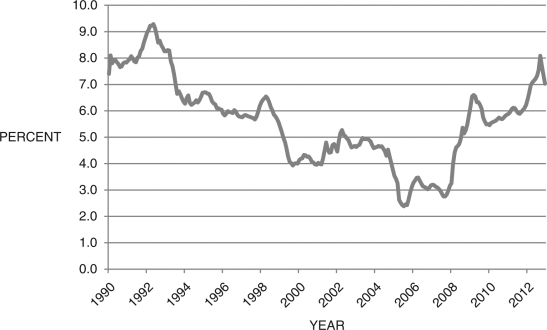 (Source: Federal Reserve Economic Data, St. Louis Federal Reserve)
-Your high school economics teacher recently saw the graph of personal savings rates above. She knows you are taking economics in college and is curious to hear your opinion about what is causing the general trends in savings rates from 1990-2012. What do you tell her?
Correct Answer:

Verified
First, consider the years 1990-2005. Mor...View Answer
Unlock this answer now
Get Access to more Verified Answers free of charge
Correct Answer:
Verified
View Answer
Unlock this answer now
Get Access to more Verified Answers free of charge
Q2: To analyze Ricardian equivalence using the neoclassical
Q3: An implication of Figure 16.2 is that
Q4: In 1992, the first Bush administration was
Q5: The equation <img src="https://d2lvgg3v3hfg70.cloudfront.net/TB6622/.jpg" alt="The equation
Q6: Refer to the following figure when answering
Q8: Your lifetime utility is a function of:<br>A)
Q9: Consider Figure 16.7 below, which shows the
Q10: Consider consumption in two periods, <img src="https://d2lvgg3v3hfg70.cloudfront.net/TB6622/.jpg"
Q11: If <span class="ql-formula" data-value="\beta"><span class="katex"><span
Q12: The consumer's lifetime utility is given as