Essay
Consider Figure 16.7 below, which shows the federal funds rate and household consumption. For your answers, use a logarithmic utility function.
(a) What is the relationship between consumption growth and the interest rate according to
the Euler equation?
(b) Does the data in the figure support or reject this relationship for the entire period? Explain.
(c) What might help explain consumption behavior, particularly in 2008-2009?Figure 16.7: Federal Funds Rate and Household Consumption: 2002-2016 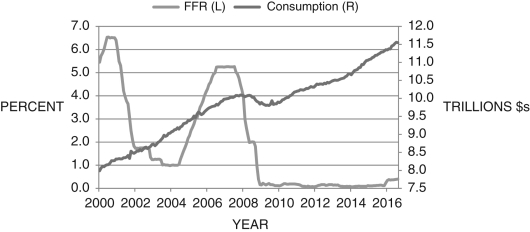
(Source: Federal Reserve Economic Data, St. Louis Federal Reserve)
Correct Answer:

Verified
We will use the notation 0 = today and 1...View Answer
Unlock this answer now
Get Access to more Verified Answers free of charge
Correct Answer:
Verified
View Answer
Unlock this answer now
Get Access to more Verified Answers free of charge
Q4: In 1992, the first Bush administration was
Q5: The equation <img src="https://d2lvgg3v3hfg70.cloudfront.net/TB6622/.jpg" alt="The equation
Q6: Refer to the following figure when answering
Q7: Figure 16.8: Personal Savings Rates <img src="https://d2lvgg3v3hfg70.cloudfront.net/TB6622/.jpg"
Q8: Your lifetime utility is a function of:<br>A)
Q10: Consider consumption in two periods, <img src="https://d2lvgg3v3hfg70.cloudfront.net/TB6622/.jpg"
Q11: If <span class="ql-formula" data-value="\beta"><span class="katex"><span
Q12: The consumer's lifetime utility is given as
Q13: The <img src="https://d2lvgg3v3hfg70.cloudfront.net/TB6622/.jpg" alt="The in
Q14: Behavioral economics blends economics with:<br>A) psychology.<br>B) marketing.<br>C)