Multiple Choice
Table 5.1
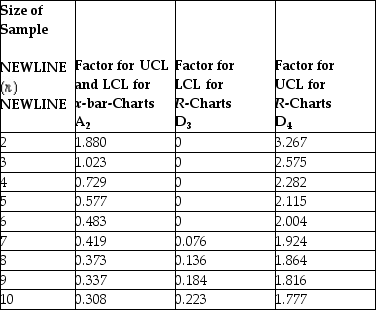
Factors for Calculating Three-Sigma Limits for the  Chart and R-Chart
 Source: 1950 ASTM Manual on Quality Control of Materials,copyright American Society for Testing Materials.Reprinted with permission.
-A milling operation has historically produced an average thickness of 0.005 inch with an average range of 0.0015 inch.Currently,the first three items from each batch of 20 are inspected.Use Table 5.1.What is the value of the lower control limit for the x-bar chart?
A) less than or equal to 0.00100
B) greater than 0.00100 but less than or equal to 0.00299
C) greater than 0.00299 but less than or equal to 0.00499
D) greater than 0.00499
Correct Answer:

Verified
Correct Answer:
Verified
Q14: In acceptance sampling, the proportion defective that
Q31: Table 5.2 <img src="https://d2lvgg3v3hfg70.cloudfront.net/TB2904/.jpg" alt="Table 5.2
Q33: Samples of size four were taken from
Q34: Table 5.2 <img src="https://d2lvgg3v3hfg70.cloudfront.net/TB2904/.jpg" alt="Table 5.2
Q53: What are any three dimensions of quality
Q80: What are the key components of the
Q129: A firm's internal program in employee involvement
Q145: On a control chart, a type I
Q179: The advantage of variable measurements is that
Q192: In SPC, the distribution of sample means:<br>A)