Multiple Choice
Table 5.2 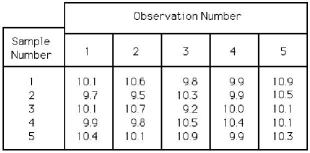
-Using Table 5.2,for the  chart,what is the value of the upper control limit for the x-bar chart?
A) less than or equal to 9.00
B) greater than 9.00 but less than or equal to 9.99
C) greater than 9.99 but less than or equal to 10.99
D) greater than 10.99
Correct Answer:

Verified
Correct Answer:
Verified
Q14: In acceptance sampling, the proportion defective that
Q29: Which of the following can be used
Q31: Table 5.2 <img src="https://d2lvgg3v3hfg70.cloudfront.net/TB2904/.jpg" alt="Table 5.2
Q33: Samples of size four were taken from
Q35: Table 5.1<br>Factors for Calculating Three-Sigma Limits for
Q53: What are any three dimensions of quality
Q80: What are the key components of the
Q145: On a control chart, a type I
Q179: The advantage of variable measurements is that
Q192: In SPC, the distribution of sample means:<br>A)