Essay
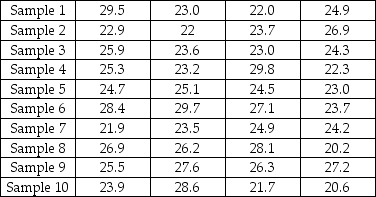
Samples of size four were taken from a process that had a target of 25 ounces with upper and lower specification limits of 30 ounces and 20 ounces respectively.Create the appropriate control charts and determine whether the process is in control.Then compute process capability.
Correct Answer:

Verified
This is variables data,so x-bar and R ch...View Answer
Unlock this answer now
Get Access to more Verified Answers free of charge
Correct Answer:
Verified
View Answer
Unlock this answer now
Get Access to more Verified Answers free of charge
Q29: Which of the following can be used
Q31: Table 5.2 <img src="https://d2lvgg3v3hfg70.cloudfront.net/TB2904/.jpg" alt="Table 5.2
Q34: Table 5.2 <img src="https://d2lvgg3v3hfg70.cloudfront.net/TB2904/.jpg" alt="Table 5.2
Q35: Table 5.1<br>Factors for Calculating Three-Sigma Limits for
Q53: What are any three dimensions of quality
Q80: What are the key components of the
Q111: The defect rate for a product has
Q145: On a control chart, a type I
Q179: The advantage of variable measurements is that
Q192: In SPC, the distribution of sample means:<br>A)