Multiple Choice
Table 5.2 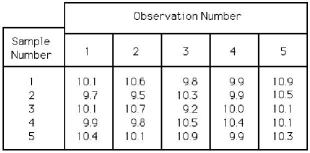
-Using Table 5.2,the sample values represent service times in minutes.For the R-chart,what is the value of UCLR?
A) less than or equal to 0.90
B) greater than 0.90 but less than or equal to 0.99
C) greater than 0.99 but less than or equal to 1.99
D) greater than 1.99
Correct Answer:

Verified
Correct Answer:
Verified
Q27: _ is the societal effect that is
Q29: Which of the following can be used
Q33: Samples of size four were taken from
Q34: Table 5.2 <img src="https://d2lvgg3v3hfg70.cloudfront.net/TB2904/.jpg" alt="Table 5.2
Q35: Table 5.1<br>Factors for Calculating Three-Sigma Limits for
Q53: What are any three dimensions of quality
Q80: What are the key components of the
Q111: The defect rate for a product has
Q135: When considering the plan-do-study-act cycle for problem
Q179: The advantage of variable measurements is that