Exam 22: Consumer Preferences and Consumer Choice
Exam 1: First Principles199 Questions
Exam 2: Economic Models: Trade-Offs and Trade299 Questions
Exam 4: Consumer and Producer Surplus229 Questions
Exam 3: Supply and Demand265 Questions
Exam 5: Price Controls and Quotas: Meddling With Markets216 Questions
Exam 6: Elasticity226 Questions
Exam 7: Taxes286 Questions
Exam 8: International Trade260 Questions
Exam 9: Decision Making by Individuals and Firms186 Questions
Exam 10: The Rational Consumer182 Questions
Exam 11: Behind the Supply Curve: Inputs and Costs317 Questions
Exam 12: Perfect Competition and the Supply Curve341 Questions
Exam 13: Monopoly317 Questions
Exam 14: Oligopoly271 Questions
Exam 15: Monopolistic Competition and Product Differentiation245 Questions
Exam 16: Externalities193 Questions
Exam 17: Public Goods and Common Resources208 Questions
Exam 18: The Economics of the Welfare State126 Questions
Exam 19: Factor Markets and the Distribution of Income316 Questions
Exam 20: Uncertainty, Risk, and Private Information192 Questions
Exam 21: Graphs in Economics60 Questions
Exam 22: Consumer Preferences and Consumer Choice135 Questions
Select questions type
The slope of a(n)_____ curve shows the rate at which two goods can be exchanged _____.
(Multiple Choice)
4.9/5  (38)
(38)
Use the following to answer question: 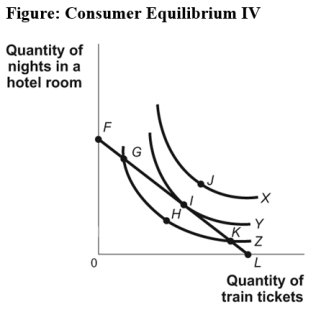 -(Figure: Consumer Equilibrium IV)Use Figure Consumer Equilibrium IV.Assume that you are consuming the combination of goods at point K.Given the budget constraint FL,utility:
(Multiple Choice)
4.9/5 (37)
In terms of indifference curves,a demand curve is generated by changes in:
(Multiple Choice)
4.9/5 (39)
Use the following to answer question: 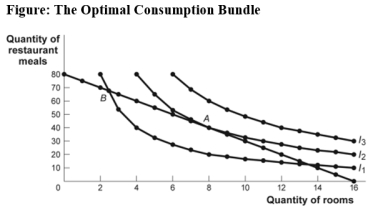 -(Figure: The Optimal Consumption Bundle)Use Figure The Optimal Consumption Bundle.Which of the following could lead to an optimal consumption bundle on indifference curve I1?
(Multiple Choice)
4.8/5 (37)
Suppose peanut butter is an inferior good for Ilya and the price of peanut butter rises.What will happen to Ilya's consumption of peanut butter?
(Multiple Choice)
4.9/5 (36)
Use the following to answer question:
-(Figure: The Optimal Consumption Bundle)Use Figure The Optimal Consumption Bundle.Which of the following could lead to an optimal consumption bundle on indifference curve I3?
(Multiple Choice)
4.7/5 (36)
Diminishing marginal utility is the reason most indifference curves:
(Multiple Choice)
4.8/5 (27)
Use the following to answer question: 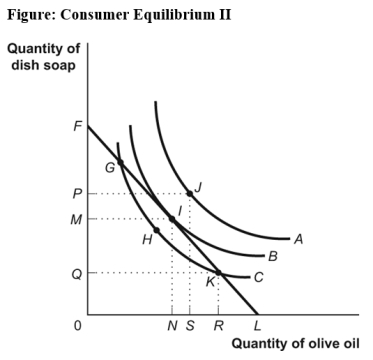 -(Figure: Consumer Equilibrium II)Use Figure Consumer Equilibrium II.Which of the following is TRUE?
(Multiple Choice)
4.8/5 (33)
Use the following to answer question: 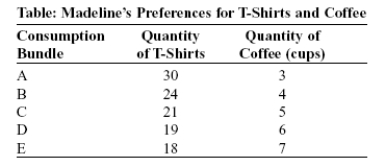 -(Table: Madeline's Preferences for T-Shirts and Coffee)Use Table Madeline's Preferences for T-Shirts and Coffee.Assume each consumption bundle provides the same level of utility.Suppose Madeline is consuming bundle A but then changes her consumption and slowly moves along her indifference curve to bundles B,C,D,and finally E.As she moves toward bundle E,she gives up:
(Multiple Choice)
4.9/5 (31)
To find her optimal consumption bundle,Vanessa would have to:
(Multiple Choice)
4.8/5 (21)
(Scenario: Music Downloads and Streamed Movies)Read the scenario Music Downloads and Streamed Movies.Which of the following equations expresses Phillip's budget line? Scenario: Music Downloads and Streamed Movies
Phillip has an income of $300 per month,which he uses to purchase music downloads (MD)and streamed movies (SM).Each music download costs $1 and each streamed movie costs $5.
(Multiple Choice)
4.9/5 (28)
Use the following to answer question: 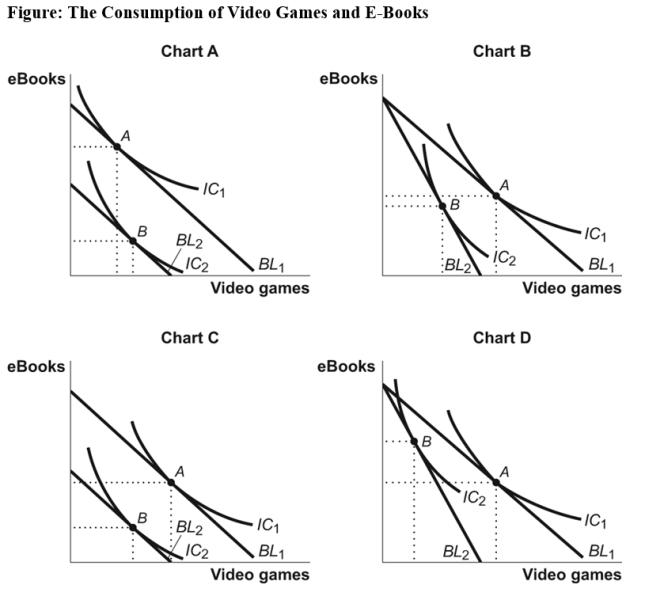 -(Figure: The Consumption of Video Games and E-Books)Use Figure The Consumption of Video Games and E-Books.Which chart shows the effects of an increase in the price of video games when video games and e-books are substitutes but not perfect substitutes?
(Multiple Choice)
4.7/5 (28)
When an individual's consumption of an additional unit of a good generates a smaller increase in total utility than the previous unit consumed,then this person's indifference curve will be:
(Multiple Choice)
4.8/5 (42)
Use the following to answer question: 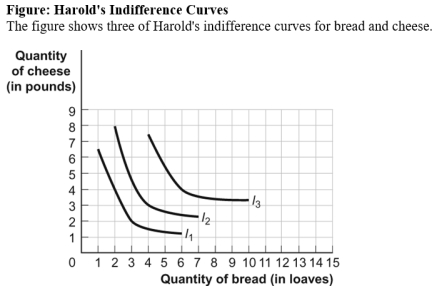 -(Figure: Harold's Indifference Curves)Use Figure Harold's Indifference Curves.If the price of bread is $2 per loaf,the price of cheese is $4 per pound,and Harold has $28 to spend on bread and cheese,Harold's optimal consumption bundle is _____ loaves of bread and _____ pounds of cheese.
(Multiple Choice)
4.7/5 (32)
Pooh spends all of his income on honey and maple syrup.Because he views honey and maple syrup as perfect substitutes,he is willing to substitute honey for maple syrup at the constant rate of 1 teaspoon of honey to 2 teaspoons of maple syrup.If the price of honey in terms of maple syrup is 2.2,Pooh's optimal consumption bundle will consist entirely of maple syrup.
(True/False)
4.8/5 (39)
Filters
- Essay(0)
- Multiple Choice(0)
- Short Answer(0)
- True False(0)
- Matching(0)