Exam 5: Efficiency and Equity
Exam 1: What Is Economics205 Questions
Exam 2: The Economic Problem145 Questions
Exam 3: Demand and Supply188 Questions
Exam 4: Elasticity166 Questions
Exam 5: Efficiency and Equity123 Questions
Exam 6: Government Actions in Markets125 Questions
Exam 7: Global Markets in Action135 Questions
Exam 8: Utility and Demand116 Questions
Exam 9: Possibilities, preferences, and Choices120 Questions
Exam 10: Output and Costs145 Questions
Exam 11: Perfect Competition114 Questions
Exam 12: Monopoly114 Questions
Exam 13: Monopolistic Competition136 Questions
Exam 14: Oligopoly100 Questions
Exam 15: Externalities114 Questions
Exam 16: Public Goods and Common Resources96 Questions
Exam 17: Markets for Factors of Production122 Questions
Exam 18: Economic Inequality115 Questions
Select questions type
According to John Rawls' modified utilitarianism,income should be redistributed until
(Multiple Choice)
4.9/5  (30)
(30)
Use the figure below to answer the following questions. 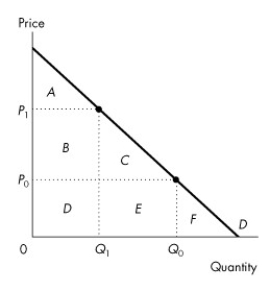 Figure 5.2.3
-Refer to Figure 5.2.3 If the price is P1,what area on the graph indicates consumer surplus?
Figure 5.2.3
-Refer to Figure 5.2.3 If the price is P1,what area on the graph indicates consumer surplus?
(Multiple Choice)
4.7/5 (34)
Use the figure below to answer the following questions. 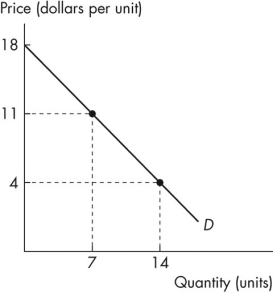 Figure 5.2.2
-Consider the demand curve in Figure 5.2.2.What is the consumer surplus when the price is $4 a unit?
Figure 5.2.2
-Consider the demand curve in Figure 5.2.2.What is the consumer surplus when the price is $4 a unit?
(Multiple Choice)
4.8/5 (42)
Use the figure below to answer the following questions. 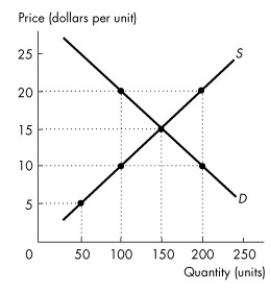 Figure 5.3.1
-Refer to Figure 5.3.1.The efficient quantity is
Figure 5.3.1
-Refer to Figure 5.3.1.The efficient quantity is
(Multiple Choice)
4.8/5 (40)
Use the information below to answer the following questions.
Fact 5.3.1
Only 1 percent of the world supply of water is fit for human consumption.Some places have more water than they can use;some could use much more than they have.The 1 percent available would be sufficient if only it were in the right place.
-Refer to Fact 5.3.1.If there were a global market in water like there is in oil,
(Multiple Choice)
5.0/5 (40)
A used truck has a sticker price of $21,000.Arthur decides that he will pay no more than $19,750 for this truck.He buys the truck for $19,250.Arthur obtains a consumer surplus of
(Multiple Choice)
4.9/5 (32)
Use the figure below to answer the following questions. 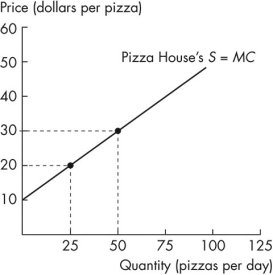
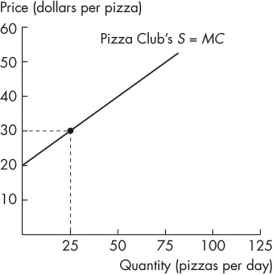 Figure 5.2.5a Figure 5.2.5b
-Figure 5.2.5 shows the supply curve for Pizza House's pizzas in the left graph and the supply curve for Pizza Club's pizzas in the right graph.If the price of a pizza is $20,what is the quantity supplied by the market if Pizza House and Pizza Club are the only firms?
Figure 5.2.5a Figure 5.2.5b
-Figure 5.2.5 shows the supply curve for Pizza House's pizzas in the left graph and the supply curve for Pizza Club's pizzas in the right graph.If the price of a pizza is $20,what is the quantity supplied by the market if Pizza House and Pizza Club are the only firms?
(Multiple Choice)
4.9/5 (35)
Alvin Roth of Harvard University designed a system that matches donated kidneys to recipients waiting for such donations.This system takes into account the needs of each perspective recipient,their blood type,and the urgency of their case.Based on this information,this allocation method for kidneys is
(Multiple Choice)
4.8/5 (37)
Use the table below to answer the following questions.
Table 5.2.1 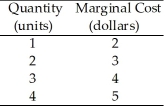 -Table 5.2.1 gives information on marginal cost for the XYZ firm.If XYZ sells the first unit at a price of $6,what is the producer surplus on that unit?
(Multiple Choice)
4.8/5 (43)
Use the figure below to answer the following questions. 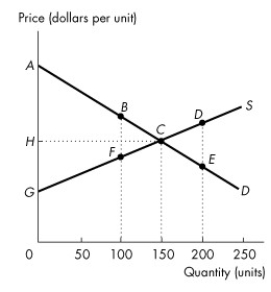 Figure 5.3.2
-Refer to Figure 5.3.2.If the level of output is 150 units,the producer surplus is area
Figure 5.3.2
-Refer to Figure 5.3.2.If the level of output is 150 units,the producer surplus is area
(Multiple Choice)
4.7/5 (50)
Use the figure below to answer the following question.  Figure 5.3.3
-Consider the demand and supply curves in Figure 5.3.3.If the market is at the competitive equilibrium,which area in the diagram indicates producer surplus?
Figure 5.3.3
-Consider the demand and supply curves in Figure 5.3.3.If the market is at the competitive equilibrium,which area in the diagram indicates producer surplus?
(Multiple Choice)
4.9/5 (46)
Use the table below to answer the following questions.
Table 5.2.1
-Refer to Table 5.2.1.If the price is $6 a unit,the producer surplus on the third unit is
(Multiple Choice)
4.9/5 (38)
Which of the following ideas describes the concept of "utilitarianism"? I.Utilitarianism was introduced in the 1930s.
II.Utilitarians believed that a society should strive to make as many people as happy as possible.
III.Utilitarians claimed that taking money from rich people and giving it to poorer people would not make an economy better off.
(Multiple Choice)
4.9/5 (41)
Charlene is willing to pay $5.00 for a sandwich.If the price of a sandwich is ________,Charlene ________.
(Multiple Choice)
4.8/5 (39)
Use the information below to answer the following question. 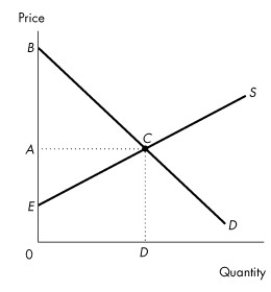 Figure 5.2.7
-Consider the demand and supply curves in Figure 5.2.7.If the market is at the competitive equilibrium,which area in the diagram indicates the cost of producing the quantity sold?
Figure 5.2.7
-Consider the demand and supply curves in Figure 5.2.7.If the market is at the competitive equilibrium,which area in the diagram indicates the cost of producing the quantity sold?
(Multiple Choice)
4.9/5 (38)
Filters
- Essay(0)
- Multiple Choice(0)
- Short Answer(0)
- True False(0)
- Matching(0)