Exam 15: Statistical Quality Control
Exam 1: Introduction to Operations Management80 Questions
Exam 2: Competitiveness, strategic Planning, and Productivity62 Questions
Exam 3: Demand Forecasting171 Questions
Exam 4: Product Design103 Questions
Exam 5: Reliability63 Questions
Exam 6: Strategic Capacity Planning75 Questions
Exam 7: Decision Analysis70 Questions
Exam 8: Process Design and Facility Layout169 Questions
Exam 9: Linear Programming98 Questions
Exam 10: Workjob Design147 Questions
Exam 11: Learning Curves67 Questions
Exam 12: Location Planning and Analysis69 Questions
Exam 13: the Transportation Model18 Questions
Exam 14: Management of Quality112 Questions
Exam 15: Statistical Quality Control132 Questions
Exam 16: Acceptance Sampling64 Questions
Exam 17: Supply Chain Management103 Questions
Exam 18: Inventory Management157 Questions
Exam 19: Aggregate Operations Planning and Master Scheduling73 Questions
Exam 20: Material Requirements Planning and Enterprise Resource Planning78 Questions
Exam 21: Just-In-Time and Lean Production89 Questions
Exam 22: Maintenance27 Questions
Exam 23: Job and Staff Scheduling116 Questions
Exam 24: Project Management131 Questions
Exam 25: Waiting-Line Analysis79 Questions
Exam 26: Simulation44 Questions
Select questions type
Using three sigma control limits (rather than two sigma limits)tends to have what impact on error probabilities?
Free
(Multiple Choice)
4.9/5  (41)
(41)
Correct Answer: Verified
A
Studies on a machine that molds plastic water pipe indicate that when it is injecting 25 mm diameter pipe,the process standard deviation is 0.50 mm.The 25 mm pipe has a specification of 25 mm plus or minus 1.0 mm.What is the process capability index (Cp)?
Free
(Multiple Choice)
4.7/5 (39)
Correct Answer:Verified
B
Given the following process control data for a normally distributed quality variable (three samples of size four each):
 If the process is known to have a mean of 15 and a standard deviation of 3,what are the three sigma upper and lower control limits for an x-bar chart?
Free
(Essay)
4.7/5 (39)
Correct Answer:Verified
15 Lower limit = 10.5 Upper limit = 19.5 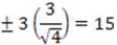
A Quality Analyst wants to construct a control chart for determining whether three machines,all producing the same product,are under control with regard to a particular quality variable.Accordingly,he sampled four units of output from each machine,with the following results:  Using the factors for three sigma control limits,what are the x-bar chart upper and lower control limits?
(Multiple Choice)
4.9/5 (27)
Given the following process control data for a quality attribute (three samples of size 400 each):
 What is the sample proportion of defectives for sample #1? #2? #3?
(Short Answer)
4.7/5 (47)
The optimum level of inspection for quality control is where the:
(Multiple Choice)
4.8/5 (26)
Four samples of three observations each have been taken,with actual measurements (in centimetres)shown below.Construct three sigma mean and range charts,and determine if corrective action is needed.
11eab92b_c48d_2c65_99e6_039f93955d70
(Essay)
4.9/5 (38)
Given the following process control data for a quality attribute (three samples of size 400 each):
 If the process is known to produce 11 percent defectives on average,what are the upper and lower control limits for an alpha risk of .10? .05? .01?
(Essay)
4.9/5 (43)
The output of a process may not conform to design specifications even though the process may be statistically "in control".
(True/False)
4.7/5 (34)
The range chart (R-chart)is most likely to detect a change in:
(Multiple Choice)
4.8/5 (39)
Variation in a sample statistic collected from a process may be either random variation or assignable variation.
(True/False)
4.8/5 (32)
For a process to be capable,it must have a capability ratio of at least 1.00.A ratio of 1.00 implies that what percent of the output of a process can be expected to be within the design specification limits?
(Multiple Choice)
4.9/5 (30)
The term "2 sigma limits" in the context of a control chart refers to the variability of the:
(Multiple Choice)
4.9/5 (45)
Quality control efforts that occur during production are referred to as statistical process control.
(True/False)
4.8/5 (33)
Assignable variation is variation due to a specific cause,such as tool wear.
(True/False)
4.8/5 (29)
The frequency and quantity of inspection depends primarily on the cost of inspection.
(True/False)
4.8/5 (35)
Given the following process control data for a quality attribute (three samples of size 400 each):
 If the process is known to produce 11 percent defectives on average,what is the alpha risk (probability of Type I error)for upper and lower control limits of .1256 and .0944 respectively? .1412 and .0788? .1568 and .0632?
(Short Answer)
5.0/5 (34)
Sample range control charts are used to measure shifts in the process mean.
(True/False)
4.8/5 (32)
Filters
- Essay(0)
- Multiple Choice(0)
- Short Answer(0)
- True False(0)
- Matching(0)