Exam 13: Using the Economic Fluctuations Model
Exam 1: The Central Idea157 Questions
Exam 2: Observing and Explaining the Economy107 Questions
Exam 3: The Supply and Demand Model170 Questions
Exam 4: Subtleties of the Supply and Demand Model: Price Floors, Price Ceilings, and Elasticity182 Questions
Exam 5: Macroeconomics: the Big Picture157 Questions
Exam 6: Measuring the Production, Income, and Spending of Nations180 Questions
Exam 7: The Spending Allocation Model170 Questions
Exam 8: Unemployment and Employment215 Questions
Exam 9: Productivity and Economic Growth165 Questions
Exam 10: Money and Inflation154 Questions
Exam 11: The Nature and Causes of Economic Fluctuations169 Questions
Exam 22: Deriving the Formula for the Keynesian Multiplier and the Forward-Looking Consumption Model28 Questions
Exam 12: The Economic Fluctuations Model206 Questions
Exam 13: Using the Economic Fluctuations Model178 Questions
Exam 14: Fiscal Policy139 Questions
Exam 15: Monetary Policy173 Questions
Exam 16: Capital and Financial Markets174 Questions
Exam 17: Economic Growth and Globalization164 Questions
Exam 18: International Trade250 Questions
Exam 19: International Finance125 Questions
Exam 20: Reading, Understanding, and Creating Graphs35 Questions
Exam 21: the Miracle of Compound Growth11 Questions
Exam 23: Present Discounted Value16 Questions
Exam 24: Deriving the Growth Accounting Formula13 Questions
Select questions type
In the late 1960s and 1970s inflation decreased around the world.
(True/False)
4.8/5  (42)
(42)
Disinflation refers to a situation in which the overall price level falls.
(True/False)
5.0/5 (43)
The long-run effect of a decrease in government purchases is represented by a rightward shift of the aggregate demand curve as interest rates decline and spending increases.
(True/False)
4.9/5 (39)
Suppose the economy is initially at point A in the diagram below, and there is a sudden increase in oil prices that the central bank believes is only temporary. Which point best depicts where the economy will end up in the short run? 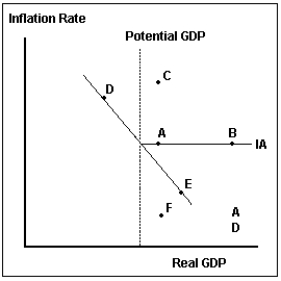
(Multiple Choice)
4.9/5 (41)
Discuss the difference in the short-run and long-run effects of a decrease in government purchases and a monetary policy change designed to lower inflation. Comment specifically on the four components of aggregate demand, interest rates, and inflation.
(Essay)
4.8/5 (30)
Suppose the GDP deflator is 100 in 2009 and 101 in 2010.
(A)Suppose the economy is at potential GDP in 2009 and 2010. What is the rate of inflation in 2010?
(B)Suppose instead that real GDP is above potential GDP in 2010. How is the adjustment back to potential made in this situation?
(Essay)
4.9/5 (41)
Exhibit 25-3 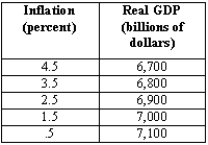 -PART I Use the data from Exhibit 25-3 to graph the aggregate demand curve:
(A)Suppose the current inflation rate is 3.5 percent and potential GDP is $6,900 billion. Draw the inflation adjustment line. What is the current deviation of real GDP from potential?
(B)In the long run, what will the inflation rate be if there is no change in economic policy? Explain how this adjustment will take place.
PART II
Suppose that after the long-run adjustment back to potential, the Fed changes its policy rule so the inflation target is 3.5 percent and potential GDP remains at $6,900 billion. Use the data to show the shift in the aggregate demand/inflation curve.
(A)What type of monetary policy is the Fed undertaking?
(B)How does the Fed accomplish this goal? What is the response of investment and net exports?
(C)In the short run, what is the deviation from potential GDP?
(D)How will the inflation adjustment line adjust in the medium and long run? Explain how this occurs.
-PART I Use the data from Exhibit 25-3 to graph the aggregate demand curve:
(A)Suppose the current inflation rate is 3.5 percent and potential GDP is $6,900 billion. Draw the inflation adjustment line. What is the current deviation of real GDP from potential?
(B)In the long run, what will the inflation rate be if there is no change in economic policy? Explain how this adjustment will take place.
PART II
Suppose that after the long-run adjustment back to potential, the Fed changes its policy rule so the inflation target is 3.5 percent and potential GDP remains at $6,900 billion. Use the data to show the shift in the aggregate demand/inflation curve.
(A)What type of monetary policy is the Fed undertaking?
(B)How does the Fed accomplish this goal? What is the response of investment and net exports?
(C)In the short run, what is the deviation from potential GDP?
(D)How will the inflation adjustment line adjust in the medium and long run? Explain how this occurs.
(Essay)
4.7/5 (32)
Suppose, for a certain economy, real and potential GDP are initially equal. Then government purchases permanently increase. Compared to the baseline, we would expect to see, in the long run,
(Multiple Choice)
4.9/5 (41)
If exports increase, investment and consumption will be lower in the long run.
(True/False)
4.9/5 (42)
Suppose the relationship between real GDP and inflation is depicted as shown in the table below. Assume that real and potential GDP are equal to each other at $5,400 billion. Suppose government purchases decline by $100 billion and the slope of the aggregate expenditure line is 0.5. 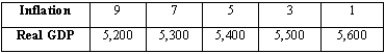 (A)Explain how the AD curve is affected by this change. In the short run, what will real GDP and the rate of inflation be?
(B)Using the AD and IA curves, show what will happen in the medium run. Be sure to give an economic explanation for what is happening.
(C)Using the AD and IA curves, show what will happen in the long run.
(A)Explain how the AD curve is affected by this change. In the short run, what will real GDP and the rate of inflation be?
(B)Using the AD and IA curves, show what will happen in the medium run. Be sure to give an economic explanation for what is happening.
(C)Using the AD and IA curves, show what will happen in the long run.
(Essay)
4.9/5 (30)
Exhibit 25-1 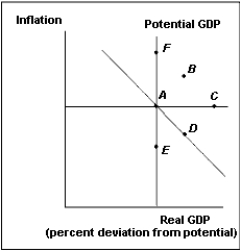 -Suppose the economy is initially at point A in Exhibit 25-1. If government purchases increase, which point best depicts where the economy will be in the short run as a result of the change in spending?
(Multiple Choice)
4.9/5 (32)
If there is a sharp increase in oil prices, in the short run
(Multiple Choice)
4.9/5 (35)
Price shocks are always accompanied by a shift in potential GDP.
(True/False)
4.8/5 (39)
The long-run interest rate effect of decreased government purchases is that
(Multiple Choice)
4.9/5 (39)
Why is the Great Depression, even though it occurred over 70 years ago, a valid topic in macroeconomics?
What explanations are offered as to what caused the Great Depression?
What caused the end of the Great Depression?
(Essay)
4.8/5 (40)
Filters
- Essay(0)
- Multiple Choice(0)
- Short Answer(0)
- True False(0)
- Matching(0)