Exam 13: Using the Economic Fluctuations Model
Exam 1: The Central Idea157 Questions
Exam 2: Observing and Explaining the Economy107 Questions
Exam 3: The Supply and Demand Model170 Questions
Exam 4: Subtleties of the Supply and Demand Model: Price Floors, Price Ceilings, and Elasticity182 Questions
Exam 5: Macroeconomics: the Big Picture157 Questions
Exam 6: Measuring the Production, Income, and Spending of Nations180 Questions
Exam 7: The Spending Allocation Model170 Questions
Exam 8: Unemployment and Employment215 Questions
Exam 9: Productivity and Economic Growth165 Questions
Exam 10: Money and Inflation154 Questions
Exam 11: The Nature and Causes of Economic Fluctuations169 Questions
Exam 22: Deriving the Formula for the Keynesian Multiplier and the Forward-Looking Consumption Model28 Questions
Exam 12: The Economic Fluctuations Model206 Questions
Exam 13: Using the Economic Fluctuations Model178 Questions
Exam 14: Fiscal Policy139 Questions
Exam 15: Monetary Policy173 Questions
Exam 16: Capital and Financial Markets174 Questions
Exam 17: Economic Growth and Globalization164 Questions
Exam 18: International Trade250 Questions
Exam 19: International Finance125 Questions
Exam 20: Reading, Understanding, and Creating Graphs35 Questions
Exam 21: the Miracle of Compound Growth11 Questions
Exam 23: Present Discounted Value16 Questions
Exam 24: Deriving the Growth Accounting Formula13 Questions
Select questions type
A decrease in government purchases causes the interest-sensitive components of GDP to increase in the long run.
(True/False)
4.9/5  (38)
(38)
Which of the following was not a factor that led to the recession that began at the end of 2007?
(Multiple Choice)
4.8/5 (39)
A change in the price of a key commodity such as oil, usually because of a shortage, that causes a shift in the inflation adjustment line is known as a
(Multiple Choice)
4.8/5 (31)
Suppose the economy is initially at potential GDP.
(A)Draw an aggregate demand curve and price adjustment line, and label the initial equilibrium with an A.
(B)Suppose government purchases increase. Illustrate the short-run effect on your diagram. Label the new equilibrium with a B.
(C)Explain the short-run effect on C, I, G, X, R, and inflation, as compared to baseline.
(D)Illustrate the long-run effect on your diagram, and label the long-run equilibrium with a C.
(E)Explain the long-run effect on C, I, G, X, R, and inflation, as compared to baseline.
(Essay)
4.8/5 (27)
The figure below shows the effect of a 2001 increase in government purchases on the hypothetical path of real GDP compared to the path of potential GDP (the baseline) between 2001 and 2005. 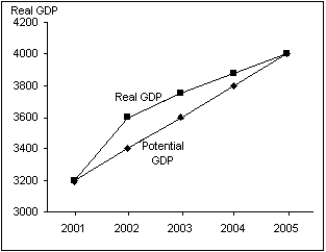 (A)Using the AD curve and IA line analysis, explain what is occurring between 2001 and 2002.
(B)Using the AD curve and IA line analysis, explain what is occurring between 2002 and 2004.
(C)Using the AD curve and IA line analysis, explain what is occurring between 2004 and 2005.
(A)Using the AD curve and IA line analysis, explain what is occurring between 2001 and 2002.
(B)Using the AD curve and IA line analysis, explain what is occurring between 2002 and 2004.
(C)Using the AD curve and IA line analysis, explain what is occurring between 2004 and 2005.
(Essay)
4.8/5 (37)
The best explanation for the recent economic fluctuations observed in the U.S. economy is
(Multiple Choice)
4.8/5 (44)
If government spending decreases, the long-run income effect on net exports and consumption will be the same as in the baseline case.
(True/False)
4.8/5 (36)
The United States economy never recovered from the recession brought about by the Volcker disinflation.
(True/False)
4.8/5 (35)
The long-run overall effect of decreased government purchases is that
(Multiple Choice)
4.9/5 (38)
An increase in the target inflation rate by the central bank is referred to as
(Multiple Choice)
4.9/5 (32)
All of the inflation that occurred in the 1970s can be explained by reinflation policies.
(True/False)
4.9/5 (35)
The short-run effects of an increase in government purchases are that inflation will ____, and real GDP will ____.
(Multiple Choice)
4.8/5 (34)
Which of the following is the best definition of disinflation?
(Multiple Choice)
4.8/5 (35)
Filters
- Essay(0)
- Multiple Choice(0)
- Short Answer(0)
- True False(0)
- Matching(0)