Exam 20: Reading, Understanding, and Creating Graphs
Exam 1: The Central Idea157 Questions
Exam 2: Observing and Explaining the Economy107 Questions
Exam 3: The Supply and Demand Model170 Questions
Exam 4: Subtleties of the Supply and Demand Model: Price Floors, Price Ceilings, and Elasticity182 Questions
Exam 5: Macroeconomics: the Big Picture157 Questions
Exam 6: Measuring the Production, Income, and Spending of Nations180 Questions
Exam 7: The Spending Allocation Model170 Questions
Exam 8: Unemployment and Employment215 Questions
Exam 9: Productivity and Economic Growth165 Questions
Exam 10: Money and Inflation154 Questions
Exam 11: The Nature and Causes of Economic Fluctuations169 Questions
Exam 22: Deriving the Formula for the Keynesian Multiplier and the Forward-Looking Consumption Model28 Questions
Exam 12: The Economic Fluctuations Model206 Questions
Exam 13: Using the Economic Fluctuations Model178 Questions
Exam 14: Fiscal Policy139 Questions
Exam 15: Monetary Policy173 Questions
Exam 16: Capital and Financial Markets174 Questions
Exam 17: Economic Growth and Globalization164 Questions
Exam 18: International Trade250 Questions
Exam 19: International Finance125 Questions
Exam 20: Reading, Understanding, and Creating Graphs35 Questions
Exam 21: the Miracle of Compound Growth11 Questions
Exam 23: Present Discounted Value16 Questions
Exam 24: Deriving the Growth Accounting Formula13 Questions
Select questions type
A positive relationship represents a situation where an increase in one variable is associated with an increase in the other variable. Draw three graphs that represent a positive relationship.
(Essay)
4.8/5  (37)
(37)
A relationship showing that exam grades are positively related to hours of study can be described by a curve that
(Multiple Choice)
4.9/5 (36)
Exhibit 2A-4 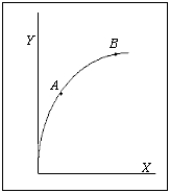 -Refer to Exhibit 2A-4. The slope of the relationship between X and Y is
(Multiple Choice)
4.7/5 (32)
Exhibit 2A-6 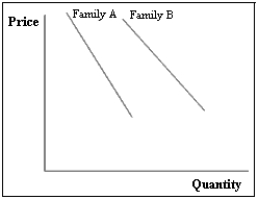 -Exhibit 2A-6 shows the relationship between the price of sodas and the quantities that two families are willing to buy. Suppose that both families are willing to buy more sodas while the soda price remain constant. Which of the following is correct?
(Multiple Choice)
4.7/5 (38)
Exhibit 2A-5 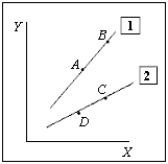 -Refer to Exhibit 2A-5. The movement from C to B is called a
(Multiple Choice)
4.7/5 (31)
Suppose the value of one variable rises while the value of another variable falls; then the slope of the relationship between the two variables is between 0 and 1.
(True/False)
4.8/5 (26)
Explain the purpose of each of the following types of graphs:
(A)Time-series graph
(B)Scatter plot
(C)Pie chart
(Essay)
4.8/5 (41)
Refer to the table below. Analyze the data on the number of meals served at small and large restaurants. The number of meals served will vary with the number of cooks employed at the restaurant. 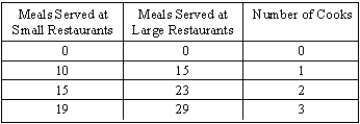 (A)Show the relationship between cooks and meals served by graphing two curves with cooks on the horizontal axis and the number of meals on the vertical axis. How do the slopes of the curves change as more cooks are employed?
(B)Is the change in the number of cooks a shift in the curve or a movement along the curve?
(C)Is the change in the size of the restaurant a shift in the curve or a movement along the curve?
(A)Show the relationship between cooks and meals served by graphing two curves with cooks on the horizontal axis and the number of meals on the vertical axis. How do the slopes of the curves change as more cooks are employed?
(B)Is the change in the number of cooks a shift in the curve or a movement along the curve?
(C)Is the change in the size of the restaurant a shift in the curve or a movement along the curve?
(Essay)
4.8/5 (30)
Consider a straight line with a slope of +1 that intersects the origin. It dissects the positive X-Y quadrant. Select any point on the line. What must be true about the distance between the origin and the X coordinate and between the origin and the Y coordinate?
(Short Answer)
4.8/5 (38)
Suppose a curve shows that every time family income increases by $1, spending increases by $.75. If spending increases by $500, then income increased by
(Multiple Choice)
4.9/5 (41)
Exhibit 2A-5
-According to Exhibit 2A-5, the slope of line 1 may be 1.25, whereas the slope of line 2 may be .75.
(True/False)
4.7/5 (35)
Filters
- Essay(0)
- Multiple Choice(0)
- Short Answer(0)
- True False(0)
- Matching(0)