Exam 25: Using the Economic Fluctuations Model
Exam 1: The Central Idea156 Questions
Exam 2: Observing and Explaining the Economy143 Questions
Exam 3: The Supply and Demand Model166 Questions
Exam 4: Subtleties of the Supply and Demand Model176 Questions
Exam 5: The Demand Curve and the Behavior of Consumers176 Questions
Exam 6: The Supply Curve and the Behavior of Firms179 Questions
Exam 7: The Efficiency of Markets163 Questions
Exam 8: Costs and the Changes at Firms Over Time191 Questions
Exam 9: The Rise and Fall of Industries139 Questions
Exam 10: Monopoly184 Questions
Exam 11: Product Differentiation, Monopolistic Competition, and Oligopoly169 Questions
Exam 12: Antitrust Policy and Regulation152 Questions
Exam 13: Labor Markets179 Questions
Exam 14: Taxes, Transfers, and Income Distribution179 Questions
Exam 15: Public Goods, Externalities, and Government Behavior197 Questions
Exam 16: Capital and Financial Markets188 Questions
Exam 17: Macroeconomics: the Big Picture159 Questions
Exam 18: Measuring the Production, Income, and Spending of Nations177 Questions
Exam 19: The Spending Allocation Model166 Questions
Exam 20: Unemployment and Employment212 Questions
Exam 21: Productivity and Economic Growth162 Questions
Exam 22: Money and Inflation153 Questions
Exam 23: The Nature and Causes of Economic Fluctuations185 Questions
Exam 24: The Economic Fluctuations Model205 Questions
Exam 25: Using the Economic Fluctuations Model176 Questions
Exam 26: Fiscal Policy138 Questions
Exam 27: Monetary Policy180 Questions
Exam 28: Economic Growth Around the World157 Questions
Exam 29: International Trade242 Questions
Exam 30: International Finance125 Questions
Select questions type
Suppose, for some hypothetical economy, an electric storm causes 90 percent of the CPU chips in the economy to become useless. Trace out the macroeconomic consequence of this phenomenon. Does this event result in stagflation? Why?
(Essay)
4.8/5  (44)
(44)
Which of the following is the best definition of disinflation?
(Multiple Choice)
4.7/5 (45)
In a diagram that includes both the IA line and the AD curve, the price adjustment resulting from an increase in spending is shown by
(Multiple Choice)
4.9/5 (31)
Exhibit 25-2 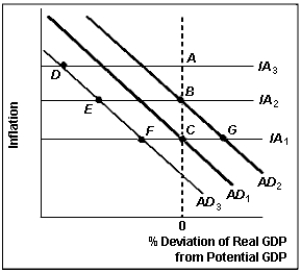 -According to Exhibit 25-2, which point best represents where the U.S. economy was in mid-2007?
(Multiple Choice)
4.8/5 (31)
Suppose, for a certain economy, real and potential GDP are initially equal. Then government purchases permanently increase. Compared to the baseline, we would expect to see, in the long run,
(Multiple Choice)
4.9/5 (43)
If oil prices increase, inflation will be permanently higher in the long run.
(True/False)
4.8/5 (32)
Filters
- Essay(0)
- Multiple Choice(0)
- Short Answer(0)
- True False(0)
- Matching(0)