Exam 19: Decision Making
Exam 1: Defining and Collecting Data189 Questions
Exam 3: Numerical Descriptive Measures184 Questions
Exam 4: Basic Probability156 Questions
Exam 5: Discrete Probability Distributions218 Questions
Exam 6: The Normal Distribution and Other Continuous Distributions189 Questions
Exam 7: Sampling Distributions127 Questions
Exam 8: Confidence Interval Estimation196 Questions
Exam 9: Fundamentals of Hypothesis Testing: One-Sample Tests170 Questions
Exam 10: Two-Sample Tests210 Questions
Exam 11: Analysis of Variance130 Questions
Exam 12: Chi-Square Tests and Nonparametric Tests175 Questions
Exam 13: Simple Linear Regression213 Questions
Exam 14: Introduction to Multiple Regression337 Questions
Exam 15: Multiple Regression Model Building96 Questions
Exam 16: Time-Series Forecasting165 Questions
Exam 17: A Roadmap for Analyzing Data303 Questions
Exam 18: Statistical Applications in Quality Management130 Questions
Exam 19: Decision Making126 Questions
Exam 20: Index Numbers44 Questions
Exam 21: Chi-Square Tests for the Variance or Standard Deviation11 Questions
Exam 22: Mcnemar Test for the Difference Between Two Proportions Related Samples15 Questions
Exam 25: The Analysis of Means Anom2 Questions
Exam 23: The Analysis of Proportions Anop3 Questions
Exam 24: The Randomized Block Design85 Questions
Exam 26: The Power of a Test41 Questions
Exam 27: Estimation and Sample Size Determination for Finite Populations13 Questions
Exam 28: Application of Confidence Interval Estimation in Auditing13 Questions
Exam 29: Sampling From Finite Populations20 Questions
Exam 30: The Normal Approximation to the Binomial Distribution27 Questions
Exam 31: Counting Rules14 Questions
Exam 32: Lets Get Started Big Things to Learn First33 Questions
Select questions type
TABLE 19-2
The following payoff matrix is given in dollars. 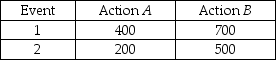 Suppose the probability of Event 1 is 0.5 and Event 2 is 0.5.
-For a potential investment of $5,000,a portfolio has an EMV of $1,000 and a standard deviation of $100.What is the coefficient of variation?
Suppose the probability of Event 1 is 0.5 and Event 2 is 0.5.
-For a potential investment of $5,000,a portfolio has an EMV of $1,000 and a standard deviation of $100.What is the coefficient of variation?
Free
(Multiple Choice)
4.8/5  (36)
(36)
Correct Answer: Verified
A
TABLE 19-6
A student wanted to find out the optimal strategy to study for a Business Statistics exam.He constructed the following payoff table based on the mean amount of time he needed to study every week for the course and the degree of difficulty of the exam.From the information that he gathered from students who had taken the course,he concluded that there was a 40% probability that the exam would be easy. 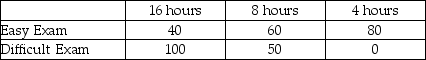 -Referring to Table 19-6,what is the opportunity loss of spending 4 hours per week on average studying for the exam when the exam turns out to be easy?
Free
(Short Answer)
4.9/5 (24)
Correct Answer:Verified
0
The risk-________ curve represents the expected monetary value approach.
Free
(Short Answer)
4.8/5 (31)
Correct Answer:Verified
neutral's
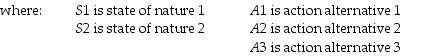
TABLE 19-1
The following payoff table shows profits associated with a set of 3 alternatives under 2 possible states of nature 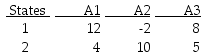
 -Referring to Table 19-1,the opportunity loss for A3 when S2 occurs is
(Multiple Choice)
5.0/5 (39)
TABLE 19-1
The following payoff table shows profits associated with a set of 3 alternatives under 2 possible states of nature
-Referring to Table 19-1,the opportunity loss for A2 when S1 occurs is
(Multiple Choice)
4.8/5 (32)
TABLE 19-1
The following payoff table shows profits associated with a set of 3 alternatives under 2 possible states of nature
-Blossom's Flowers purchases roses for sale for Valentine's Day.The roses are purchased for $10 a dozen and are sold for $20 a dozen.Any roses not sold on Valentine's Day can be sold for $5 per dozen.The owner will purchase 1 of 3 amounts of roses for Valentine's Day: 100,200,or 400 dozen roses.Given 0.2,0.4,and 0.6 are the probabilities for the sale of 100,200,or 400 dozen roses,respectively,then the EVPI for buying roses is
(Multiple Choice)
4.7/5 (30)
TABLE 19-1
The following payoff table shows profits associated with a set of 3 alternatives under 2 possible states of nature
-Blossom's Flowers purchases roses for sale for Valentine's Day.The roses are purchased for $10 a dozen and are sold for $20 a dozen.Any roses not sold on Valentine's Day can be sold for $5 per dozen.The owner will purchase 1 of 3 amounts of roses for Valentine's Day: 100,200,or 400 dozen roses.Given 0.2,0.4,and 0.6 are the probabilities for the sale of 100,200,or 400 dozen roses,respectively,then the optimal EOL for buying roses is
(Multiple Choice)
4.8/5 (34)
TABLE 19-1
The following payoff table shows profits associated with a set of 3 alternatives under 2 possible states of nature
-Referring to Table 19-1,if the probability of S1 is 0.5,then the expected monetary value (EMV)for A1 is
(Multiple Choice)
4.8/5 (35)
The curve for the ________ will show a rapid increase in utility for initial amounts of money followed by a gradual leveling off for increasing dollar amounts.
(Multiple Choice)
4.8/5 (34)
A tabular presentation that shows the outcome for each decision alternative under the various states of nature is called
(Multiple Choice)
4.8/5 (29)
TABLE 19-2
The following payoff matrix is given in dollars. Suppose the probability of Event 1 is 0.5 and Event 2 is 0.5.
-For a potential investment of $5,000,a portfolio has an EMV of $1,000 and a standard deviation of $100.What is the rate of return?
(Multiple Choice)
4.8/5 (36)
TABLE 19-1
The following payoff table shows profits associated with a set of 3 alternatives under 2 possible states of nature
-Referring to Table 19-1,if the probability of S1 is 0.4,then the probability of S2 is
(Multiple Choice)
4.8/5 (35)
TABLE 19-2
The following payoff matrix is given in dollars. Suppose the probability of Event 1 is 0.5 and Event 2 is 0.5.
-Referring to Table 19-2,the coefficient of variation for Action A is
(Multiple Choice)
4.8/5 (38)
At Eastern University,60% of the students are from suburban areas,30% are from rural areas,and 10% are from urban areas.Of the students from the suburban areas,60% are nonbusiness majors.Of the students from the rural areas,70% are nonbusiness majors.Of the students from the urban areas,90% are nonbusiness majors.The probability that a randomly selected student is a business major is
(Multiple Choice)
5.0/5 (42)
TABLE 19-1
The following payoff table shows profits associated with a set of 3 alternatives under 2 possible states of nature
-Referring to Table 19-1,what is the best action using the maximax criterion?
(Multiple Choice)
4.8/5 (42)
TABLE 19-2
The following payoff matrix is given in dollars. Suppose the probability of Event 1 is 0.5 and Event 2 is 0.5.
-Referring to Table 19-2,what is the action with the preferable return to risk ratio?
(Multiple Choice)
4.8/5 (36)
TABLE 19-1
The following payoff table shows profits associated with a set of 3 alternatives under 2 possible states of nature
-Referring to Table 19-1,if the probability of S1 is 0.5,then the coefficient of variation for A2 is
(Multiple Choice)
4.9/5 (39)
TABLE 19-5
The following payoff table shows profits associated with a set of 2 alternatives under 3 possible events. 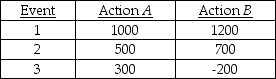 Suppose that the probability of Event 1 is 0.2,Event 2 is 0.5,and Event 3 is 0.3.
-Referring to Table 19-5,what is the EVPI for this problem?
Suppose that the probability of Event 1 is 0.2,Event 2 is 0.5,and Event 3 is 0.3.
-Referring to Table 19-5,what is the EVPI for this problem?
(Short Answer)
4.9/5 (30)
True or False: To calculate expected profit under certainty,you need to have perfect information about which event will occur.
(True/False)
4.8/5 (26)
TABLE 19-6
A student wanted to find out the optimal strategy to study for a Business Statistics exam.He constructed the following payoff table based on the mean amount of time he needed to study every week for the course and the degree of difficulty of the exam.From the information that he gathered from students who had taken the course,he concluded that there was a 40% probability that the exam would be easy.
-True or False: Referring to Table 19-6,the optimal strategy using the expected monetary value criterion is to study 16 hours per week on average for the exam.
(True/False)
4.8/5 (28)
Filters
- Essay(0)
- Multiple Choice(0)
- Short Answer(0)
- True False(0)
- Matching(0)