Exam 11: Analysis of Variance
Exam 1: Defining and Collecting Data189 Questions
Exam 3: Numerical Descriptive Measures184 Questions
Exam 4: Basic Probability156 Questions
Exam 5: Discrete Probability Distributions218 Questions
Exam 6: The Normal Distribution and Other Continuous Distributions189 Questions
Exam 7: Sampling Distributions127 Questions
Exam 8: Confidence Interval Estimation196 Questions
Exam 9: Fundamentals of Hypothesis Testing: One-Sample Tests170 Questions
Exam 10: Two-Sample Tests210 Questions
Exam 11: Analysis of Variance130 Questions
Exam 12: Chi-Square Tests and Nonparametric Tests175 Questions
Exam 13: Simple Linear Regression213 Questions
Exam 14: Introduction to Multiple Regression337 Questions
Exam 15: Multiple Regression Model Building96 Questions
Exam 16: Time-Series Forecasting165 Questions
Exam 17: A Roadmap for Analyzing Data303 Questions
Exam 18: Statistical Applications in Quality Management130 Questions
Exam 19: Decision Making126 Questions
Exam 20: Index Numbers44 Questions
Exam 21: Chi-Square Tests for the Variance or Standard Deviation11 Questions
Exam 22: Mcnemar Test for the Difference Between Two Proportions Related Samples15 Questions
Exam 25: The Analysis of Means Anom2 Questions
Exam 23: The Analysis of Proportions Anop3 Questions
Exam 24: The Randomized Block Design85 Questions
Exam 26: The Power of a Test41 Questions
Exam 27: Estimation and Sample Size Determination for Finite Populations13 Questions
Exam 28: Application of Confidence Interval Estimation in Auditing13 Questions
Exam 29: Sampling From Finite Populations20 Questions
Exam 30: The Normal Approximation to the Binomial Distribution27 Questions
Exam 31: Counting Rules14 Questions
Exam 32: Lets Get Started Big Things to Learn First33 Questions
Select questions type
The degrees of freedom for the F test in a one-way ANOVA are
Free
(Multiple Choice)
4.9/5  (26)
(26)
Correct Answer: Verified
B
In a one-way ANOVA,the null hypothesis is always
Free
(Multiple Choice)
4.7/5 (23)
Correct Answer:Verified
A
In a one-way ANOVA,if the computed F statistic is greater than the critical F value you may
Free
(Multiple Choice)
4.9/5 (34)
Correct Answer:Verified
B
TABLE 11-4
An agronomist wants to compare the crop yield of 3 varieties of chickpea seeds.She plants 15 fields,5 with each variety.She then measures the crop yield in bushels per acre.Treating this as a completely randomized design,the results are presented in the table that follows. 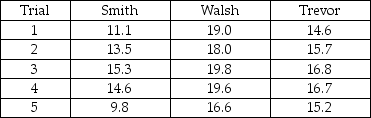 -Referring to Table 11-4,the value of the test statistic is ________.
(Short Answer)
4.9/5 (34)
TABLE 11-5
A hotel chain has identically small sized resorts in 5 locations in different small islands.The data that follow resulted from analyzing the hotel occupancies on randomly selected days in the 5 locations.  Analysis of Variance
 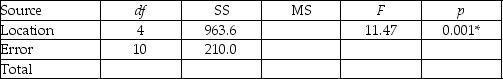 * or p < 0.005,tabular value
-Referring to Table 11-5,the numerator and denominator degrees of freedom of the test ratio are ________ and ________,respectively.
* or p < 0.005,tabular value
-Referring to Table 11-5,the numerator and denominator degrees of freedom of the test ratio are ________ and ________,respectively.
(Short Answer)
4.9/5 (36)
TABLE 11-7
A campus researcher wanted to investigate the factors that affect visitor travel time in a complex,multilevel building on campus.Specifically,he wanted to determine whether different building signs (building maps versus wall signage)affect the total amount of time visitors require to reach their destination and whether that time depends on whether the starting location is inside or outside the building.Three subjects were assigned to each of the combinations of signs and starting locations,and travel time in seconds from beginning to destination was recorded.An Excel output of the appropriate analysis is given below:
ANOVA 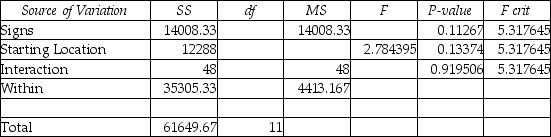 -Referring to Table 11-7,the F test statistic for testing the interaction effect between the types of signs and the starting location is
(Multiple Choice)
4.7/5 (28)
TABLE 11-4
An agronomist wants to compare the crop yield of 3 varieties of chickpea seeds.She plants 15 fields,5 with each variety.She then measures the crop yield in bushels per acre.Treating this as a completely randomized design,the results are presented in the table that follows.
-True or False: Referring to Table 11-4,based on the Tukey-Kramer procedure with an overall level of significance of 0.01,the agronomist would decide that there is a significant difference between the crop yield of Smith and Walsh seeds.
(True/False)
4.8/5 (32)
TABLE 11-3
As part of an evaluation program,a sporting goods retailer wanted to compare the downhill coasting speeds of 4 brands of bicycles.She took 3 of each brand and determined their maximum downhill speeds.The results are presented in miles per hour in the table below. 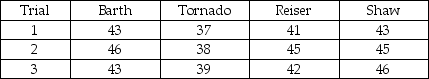 -Referring to Table 11-3,the value of MSA is ________,while MSW is ________.
(Short Answer)
4.8/5 (38)
TABLE 11-5
A hotel chain has identically small sized resorts in 5 locations in different small islands.The data that follow resulted from analyzing the hotel occupancies on randomly selected days in the 5 locations. Analysis of Variance * or p < 0.005,tabular value
-True or False: A completely randomized design with 4 groups would have 6 possible pairwise comparisons.
(True/False)
4.8/5 (35)
TABLE 11-3
As part of an evaluation program,a sporting goods retailer wanted to compare the downhill coasting speeds of 4 brands of bicycles.She took 3 of each brand and determined their maximum downhill speeds.The results are presented in miles per hour in the table below.
-True or False: Referring to Table 11-3,the test is valid only if the population of speeds has the same variance for the 4 brands.
(True/False)
4.8/5 (29)
TABLE 11-9
The marketing manager of a company producing a new cereal aimed for children wants to examine the effect of the color and shape of the box's logo on the approval rating of the cereal.He combined 4 colors and 3 shapes to produce a total of 12 designs.Each logo was presented to 2 different groups (a total of 24 groups)and the approval rating for each was recorded and is shown below.The manager analyzed these data using the α = 0.05 level of significance for all inferences. 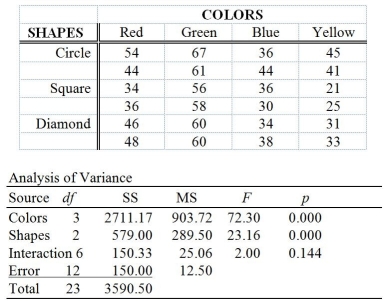 -Referring to Table 11-9,the mean square for the factor color is ________.
(Short Answer)
4.8/5 (30)
TABLE 11-2
A realtor wants to compare the mean sales-to-appraisal ratios of residential properties sold in four neighborhoods (A,B,C,and D).Four properties are randomly selected from each neighborhood and the ratios recorded for each,as shown below.
A: 1.2,1.1,0.9,0.4 C: 1.0,1.5,1.1,1.3
B: 2.5,2.1,1.9,1.6 D: 0.8,1.3,1.1,0.7
Interpret the results of the analysis summarized in the following table: 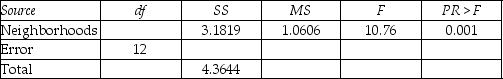 -Referring to Table 11-2,the numerator and denominator degrees of freedom for Levene's test for homogeneity of variances at a 5% level of significance are,respectively,
(Multiple Choice)
4.8/5 (34)
TABLE 11-2
A realtor wants to compare the mean sales-to-appraisal ratios of residential properties sold in four neighborhoods (A,B,C,and D).Four properties are randomly selected from each neighborhood and the ratios recorded for each,as shown below.
A: 1.2,1.1,0.9,0.4 C: 1.0,1.5,1.1,1.3
B: 2.5,2.1,1.9,1.6 D: 0.8,1.3,1.1,0.7
Interpret the results of the analysis summarized in the following table:
-Referring to Table 11-2,the null hypothesis for Levene's test for homogeneity of variances is
(Multiple Choice)
4.7/5 (45)
TABLE 11-4
An agronomist wants to compare the crop yield of 3 varieties of chickpea seeds.She plants 15 fields,5 with each variety.She then measures the crop yield in bushels per acre.Treating this as a completely randomized design,the results are presented in the table that follows.
-Referring to Table 11-4,the among-group variation or SSA is ________.
(Short Answer)
4.8/5 (43)
TABLE 11-3
As part of an evaluation program,a sporting goods retailer wanted to compare the downhill coasting speeds of 4 brands of bicycles.She took 3 of each brand and determined their maximum downhill speeds.The results are presented in miles per hour in the table below.
-True or False: Referring to Table 11-3,the test is valid only if the population of speeds is normally distributed.
(True/False)
4.8/5 (40)
TABLE 11-5
A hotel chain has identically small sized resorts in 5 locations in different small islands.The data that follow resulted from analyzing the hotel occupancies on randomly selected days in the 5 locations. Analysis of Variance * or p < 0.005,tabular value
-Referring to Table 11-5,what should be the decision for the Levene's test for homogeneity of variances at a 5% level of significance?
(Multiple Choice)
4.9/5 (34)
TABLE 11-5
A hotel chain has identically small sized resorts in 5 locations in different small islands.The data that follow resulted from analyzing the hotel occupancies on randomly selected days in the 5 locations. Analysis of Variance * or p < 0.005,tabular value
-True or False: Referring to Table 11-5,the total mean squares is 261.90.
(True/False)
4.8/5 (35)
TABLE 11-9
The marketing manager of a company producing a new cereal aimed for children wants to examine the effect of the color and shape of the box's logo on the approval rating of the cereal.He combined 4 colors and 3 shapes to produce a total of 12 designs.Each logo was presented to 2 different groups (a total of 24 groups)and the approval rating for each was recorded and is shown below.The manager analyzed these data using the α = 0.05 level of significance for all inferences.
-Referring to Table 11-9,the critical value in the test for a significant interaction is ________.
(Short Answer)
4.8/5 (37)
TABLE 11-5
A hotel chain has identically small sized resorts in 5 locations in different small islands.The data that follow resulted from analyzing the hotel occupancies on randomly selected days in the 5 locations. Analysis of Variance * or p < 0.005,tabular value
-True or False: In a two-factor ANOVA analysis,the sum of squares due to both factors,the interaction sum of squares and the within sum of squares must add up to the total sum of squares.
(True/False)
4.8/5 (41)
Filters
- Essay(0)
- Multiple Choice(0)
- Short Answer(0)
- True False(0)
- Matching(0)