Exam 3: Numerical Descriptive Measures
Exam 1: Defining and Collecting Data189 Questions
Exam 3: Numerical Descriptive Measures184 Questions
Exam 4: Basic Probability156 Questions
Exam 5: Discrete Probability Distributions218 Questions
Exam 6: The Normal Distribution and Other Continuous Distributions189 Questions
Exam 7: Sampling Distributions127 Questions
Exam 8: Confidence Interval Estimation196 Questions
Exam 9: Fundamentals of Hypothesis Testing: One-Sample Tests170 Questions
Exam 10: Two-Sample Tests210 Questions
Exam 11: Analysis of Variance130 Questions
Exam 12: Chi-Square Tests and Nonparametric Tests175 Questions
Exam 13: Simple Linear Regression213 Questions
Exam 14: Introduction to Multiple Regression337 Questions
Exam 15: Multiple Regression Model Building96 Questions
Exam 16: Time-Series Forecasting165 Questions
Exam 17: A Roadmap for Analyzing Data303 Questions
Exam 18: Statistical Applications in Quality Management130 Questions
Exam 19: Decision Making126 Questions
Exam 20: Index Numbers44 Questions
Exam 21: Chi-Square Tests for the Variance or Standard Deviation11 Questions
Exam 22: Mcnemar Test for the Difference Between Two Proportions Related Samples15 Questions
Exam 25: The Analysis of Means Anom2 Questions
Exam 23: The Analysis of Proportions Anop3 Questions
Exam 24: The Randomized Block Design85 Questions
Exam 26: The Power of a Test41 Questions
Exam 27: Estimation and Sample Size Determination for Finite Populations13 Questions
Exam 28: Application of Confidence Interval Estimation in Auditing13 Questions
Exam 29: Sampling From Finite Populations20 Questions
Exam 30: The Normal Approximation to the Binomial Distribution27 Questions
Exam 31: Counting Rules14 Questions
Exam 32: Lets Get Started Big Things to Learn First33 Questions
Select questions type
TABLE 2-13
Given below is the stem-and-leaf display representing the amount of detergent used in gallons (with leaves in 10ths of gallons)in a day by 25 drive-through car wash operations in Phoenix. 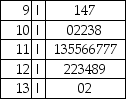 -Referring to Table 2-13,if a relative frequency or percentage distribution for the detergent data is constructed,using "9.0 but less than 10.0 gallons" as the first class,what percentage of drive-through car wash operations use at least 10 gallons of detergent in a day?
Free
(Short Answer)
4.9/5  (29)
(29)
Correct Answer: Verified
88%
True or False: Histograms are used for numerical data while bar charts are suitable for categorical data.
Free
(True/False)
4.8/5 (32)
Correct Answer:Verified
True
TABLE 2-13
Given below is the stem-and-leaf display representing the amount of detergent used in gallons (with leaves in 10ths of gallons)in a day by 25 drive-through car wash operations in Phoenix.
-Referring to Table 2-13,construct a frequency distribution for the detergent data,using "9.0 but less than 10.0 gallons" as the first class.
Free
(Essay)
4.9/5 (36)
Correct Answer:Verified
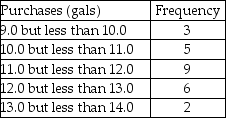
TABLE 2-12
The table below contains the opinions of a sample of 200 people broken down by gender about the latest congressional plan to eliminate anti-trust exemptions for professional baseball. 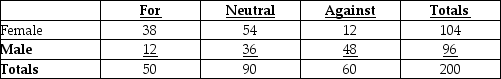 -Referring to Table 2-12,of those neutral in the sample,________ percent were males.
(Short Answer)
4.7/5 (31)
You have collected data on the responses to two questions asked in a survey of 40 college students majoring in business-"What is your gender (Male = M; Female = F.?" and "What is your major (Accountancy = A; Computer Information Systems = C; Marketing = M)?" Which of the following is the best for presenting the data?
(Multiple Choice)
4.8/5 (30)
TABLE 2-18
The stem-and-leaf display below shows the result of a survey of 50 students on their satisfaction with their school,with the higher scores representing a higher level of satisfaction. 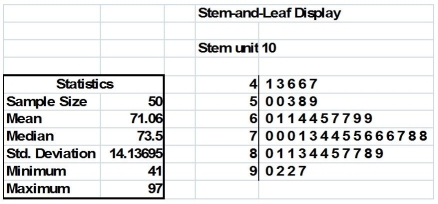 -True or False: Given below is the scatter plot of the price/earnings ratio versus earnings per share of 20 U.S.companies.There appears to be a positive relationship between price/earnings ratio and earnings per share.
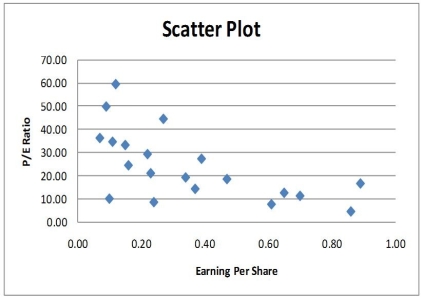
(True/False)
4.7/5 (27)
In right-skewed distributions,which of the following is the correct statement?
(Multiple Choice)
4.8/5 (31)
TABLE 2-6
A sample of 200 students at a Big-Ten university was taken after the midterm to ask them whether they went bar hopping the weekend before the midterm or spent the weekend studying,and whether they did well or poorly on the midterm.The following table contains the result. 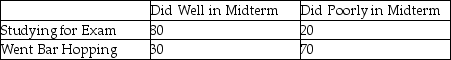 -Referring to Table 2-6,if the sample is a good representation of the population,we can expect ________ percent of those who did poorly on the midterm to have spent the weekend studying.
(Multiple Choice)
4.8/5 (37)
TABLE 2-9
The frequency distribution below represents the rents of 250 randomly selected federally subsidized apartments in a small town. 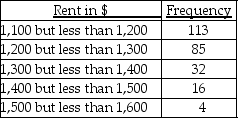 -Referring to Table 2-9,the class midpoint of the second class is ________.
(Short Answer)
4.7/5 (27)
TABLE 2-8
The Stem-and-Leaf display represents the number of times in a year that a random sample of 100 "lifetime" members of a health club actually visited the facility.  -Referring to Table 2-8,if a frequency distribution with equal sized classes was made from this data,and the first class was "0 but less than 10," the frequency of the fifth class would be ________.
(Short Answer)
4.9/5 (32)
TABLE 2-6
A sample of 200 students at a Big-Ten university was taken after the midterm to ask them whether they went bar hopping the weekend before the midterm or spent the weekend studying,and whether they did well or poorly on the midterm.The following table contains the result.
-Referring to Table 2-6,________ percent of the students in the sample spent the weekend studying and did well on the midterm.
(Multiple Choice)
4.8/5 (43)
TABLE 2-9
The frequency distribution below represents the rents of 250 randomly selected federally subsidized apartments in a small town.
-Referring to Table 2-9,________ of the apartments rented for at least $1,300.
(Short Answer)
5.0/5 (33)
TABLE 2-12
The table below contains the opinions of a sample of 200 people broken down by gender about the latest congressional plan to eliminate anti-trust exemptions for professional baseball.
-Referring to Table 2-12,________ percent of the 200 were females who were either neutral or against the plan.
(Short Answer)
4.9/5 (37)
TABLE 2-9
The frequency distribution below represents the rents of 250 randomly selected federally subsidized apartments in a small town.
-Referring to Table 2-9,________ apartments rented for at least $1,200 but less than $1,400.
(Short Answer)
4.8/5 (37)
TABLE 2-8
The Stem-and-Leaf display represents the number of times in a year that a random sample of 100 "lifetime" members of a health club actually visited the facility.
-Referring to Table 2-8,the person who has the largest leaf associated with the smallest stem visited the facility ________ times.
(Short Answer)
4.9/5 (26)
TABLE 2-14
The table below contains the number of people who own a portable Blu-ray player in a sample of 600 broken down by gender. 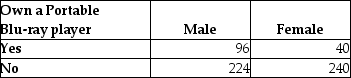 -Referring to Table 2-14,________ percent of the 600 did not own a portable Blu-ray player.
(Short Answer)
4.7/5 (28)
TABLE 2-10
The histogram below represents scores achieved by 200 job applicants on a personality profile. 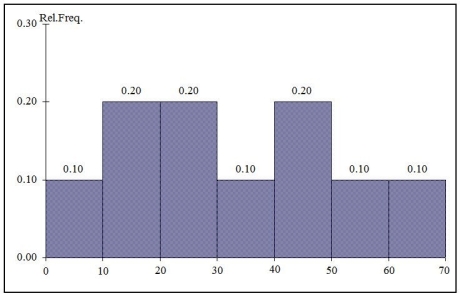 -Referring to the histogram from Table 2-10,________ percent of the applicants scored between 20 and below 50.
(Short Answer)
4.7/5 (38)
TABLE 2-10
The histogram below represents scores achieved by 200 job applicants on a personality profile.
-Referring to the histogram from Table 2-10,the number of job applicants who scored 50 or above is ________.
(Short Answer)
4.9/5 (36)
Which descriptive summary measures are considered to be resistant statistics?
(Multiple Choice)
4.7/5 (37)
TABLE 2-12
The table below contains the opinions of a sample of 200 people broken down by gender about the latest congressional plan to eliminate anti-trust exemptions for professional baseball.
-Referring to Table 2-12,if the sample is a good representation of the population,we can expect ________ percent of the females in the population will not be against the plan.
(Short Answer)
4.9/5 (40)
Filters
- Essay(0)
- Multiple Choice(0)
- Short Answer(0)
- True False(0)
- Matching(0)