Exam 10: Two-Sample Tests
Exam 1: Defining and Collecting Data189 Questions
Exam 3: Numerical Descriptive Measures184 Questions
Exam 4: Basic Probability156 Questions
Exam 5: Discrete Probability Distributions218 Questions
Exam 6: The Normal Distribution and Other Continuous Distributions189 Questions
Exam 7: Sampling Distributions127 Questions
Exam 8: Confidence Interval Estimation196 Questions
Exam 9: Fundamentals of Hypothesis Testing: One-Sample Tests170 Questions
Exam 10: Two-Sample Tests210 Questions
Exam 11: Analysis of Variance130 Questions
Exam 12: Chi-Square Tests and Nonparametric Tests175 Questions
Exam 13: Simple Linear Regression213 Questions
Exam 14: Introduction to Multiple Regression337 Questions
Exam 15: Multiple Regression Model Building96 Questions
Exam 16: Time-Series Forecasting165 Questions
Exam 17: A Roadmap for Analyzing Data303 Questions
Exam 18: Statistical Applications in Quality Management130 Questions
Exam 19: Decision Making126 Questions
Exam 20: Index Numbers44 Questions
Exam 21: Chi-Square Tests for the Variance or Standard Deviation11 Questions
Exam 22: Mcnemar Test for the Difference Between Two Proportions Related Samples15 Questions
Exam 25: The Analysis of Means Anom2 Questions
Exam 23: The Analysis of Proportions Anop3 Questions
Exam 24: The Randomized Block Design85 Questions
Exam 26: The Power of a Test41 Questions
Exam 27: Estimation and Sample Size Determination for Finite Populations13 Questions
Exam 28: Application of Confidence Interval Estimation in Auditing13 Questions
Exam 29: Sampling From Finite Populations20 Questions
Exam 30: The Normal Approximation to the Binomial Distribution27 Questions
Exam 31: Counting Rules14 Questions
Exam 32: Lets Get Started Big Things to Learn First33 Questions
Select questions type
TABLE 10-13
The amount of time required to reach a customer service representative has a huge impact on customer satisfaction.Below is the Excel output from a study to see whether there is evidence of a difference in the mean amounts of time required to reach a customer service representative between two hotels.Assume that the population variances in the amount of time for the two hotels are not equal.  -Referring to Table 10-13,what is(are)the critical value(s)of the relevant hypothesis test if the level of significance is 0.05?
Free
(Multiple Choice)
4.9/5  (25)
(25)
Correct Answer: Verified
D
True or False: The sample size in each independent sample must be the same if we are to test for differences between the means of two independent populations.
Free
(True/False)
4.9/5 (43)
Correct Answer:Verified
False
Given the following information,calculate sp2,the pooled sample variance that should be used in the pooled-variance t test. s12 = 4 s22 = 6
N1 = 16 n2 = 25
Free
(Multiple Choice)
4.7/5 (38)
Correct Answer:Verified
C
True or False: For all two-sample tests,the sample sizes must be equal in the two groups.
(True/False)
4.9/5 (34)
TABLE 10-6
To investigate the efficacy of a diet,a random sample of 16 male patients is selected from a population of adult males using the diet.The weight of each individual in the sample is taken at the start of the diet and at a medical follow-up 4 weeks later.Assuming that the population of differences in weight before versus after the diet follow a normal distribution,the t-test for related samples can be used to determine if there was a significant decrease in the mean weight during this period.Suppose the mean decrease in weights over all 16 subjects in the study is 3.0 pounds with the standard deviation of differences computed as 6.0 pounds.
-Referring to Table 10-6,the p-value for a two-tail is ________.
(Essay)
4.8/5 (45)
TABLE 10-3
A real estate company is interested in testing whether the mean time that families in Gotham have been living in their current homes is less than families in Metropolis.Assume that the two population variances are equal.A random sample of 100 families from Gotham and a random sample of 150 families in Metropolis yield the following data on length of residence in current homes.
Gotham:  G = 35 months,
  = 900 Metropolis:
  M = 50 months,
  = 1050
-Referring to Table 10-3,what is the estimated standard error of the difference between the 2 sample means?
= 1050
-Referring to Table 10-3,what is the estimated standard error of the difference between the 2 sample means?
(Multiple Choice)
4.8/5 (31)
TABLE 10-15
The table below presents the summary statistics for the starting annual salaries (in thousands of dollars)for individuals entering the public accounting and financial planning professions.
Sample I (public accounting):  1 = 60.35,S1 = 3.25,n1 = 12
Sample II (financial planning):
1 = 60.35,S1 = 3.25,n1 = 12
Sample II (financial planning):  2 = 58.20,S2 = 2.48,n2 = 14
Test whether the mean starting annual salaries for individuals entering the public accounting professions is higher than that of financial planning assuming that the two population variances are the same.
-Referring to Table 10-15,what additional assumption is needed for the test to be valid?
2 = 58.20,S2 = 2.48,n2 = 14
Test whether the mean starting annual salaries for individuals entering the public accounting professions is higher than that of financial planning assuming that the two population variances are the same.
-Referring to Table 10-15,what additional assumption is needed for the test to be valid?
(Multiple Choice)
4.8/5 (33)
TABLE 10-13
The amount of time required to reach a customer service representative has a huge impact on customer satisfaction.Below is the Excel output from a study to see whether there is evidence of a difference in the mean amounts of time required to reach a customer service representative between two hotels.Assume that the population variances in the amount of time for the two hotels are not equal.
-Referring to Table 10-13,suppose α = 0.05.Which of the following represents the result of the relevant hypothesis test?
(Multiple Choice)
4.8/5 (30)
TABLE 10-11
The dean of a college is interested in the proportion of graduates from his college who have a job offer on graduation day.He is particularly interested in seeing if there is a difference in this proportion for accounting and economics majors.In a random sample of 100 of each type of major at graduation,he found that 65 accounting majors and 52 economics majors had job offers.If the accounting majors are designated as "Group 1" and the economics majors are designated as "Group 2," perform the appropriate hypothesis test using a level of significance of 0.05.
-True or False: Referring to Table 10-11,the same decision would be made with this test if the level of significance had been 0.01 rather than 0.05.
(True/False)
4.9/5 (37)
TABLE 10-7
A buyer for a manufacturing plant suspects that his primary supplier of raw materials is overcharging.In order to determine if his suspicion is correct,he contacts a second supplier and asks for the prices on various identical materials.He wants to compare these prices with those of his primary supplier.The data collected is presented in the table below,with some summary statistics presented (all of these might not be necessary to answer the questions which follow).The buyer believes that the differences are normally distributed and will use this sample to perform an appropriate test at a level of significance of 0.01. 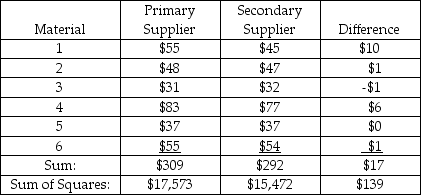 -A powerful women's group has claimed that men and women differ in attitudes about sexual discrimination.A group of 50 men (group 1)and 40 women (group 2)were asked if they thought sexual discrimination is a problem in the United States.Of those sampled,11 of the men and 19 of the women did believe that sexual discrimination is a problem.Construct a 95% confidence interval estimate of the difference between the proportion of men and women who believe that sexual discrimination is a problem.
(Short Answer)
4.9/5 (41)
True or False: A statistics professor wanted to test whether the grades on a statistics test were the same for upper and lower classmen.The professor took a random sample size of 10 from each,conducted a test and found out that the variances were equal.For this situation,the professor should use a t test with independent samples.
(True/False)
4.9/5 (36)
If we are testing for the difference between the means of 2 independent populations presuming equal variances with samples of n1 = 20 and n2 = 20,the number of degrees of freedom is equal to
(Multiple Choice)
4.9/5 (34)
TABLE 10-7
A buyer for a manufacturing plant suspects that his primary supplier of raw materials is overcharging.In order to determine if his suspicion is correct,he contacts a second supplier and asks for the prices on various identical materials.He wants to compare these prices with those of his primary supplier.The data collected is presented in the table below,with some summary statistics presented (all of these might not be necessary to answer the questions which follow).The buyer believes that the differences are normally distributed and will use this sample to perform an appropriate test at a level of significance of 0.01.
-A powerful women's group has claimed that men and women differ in attitudes about sexual discrimination.A group of 50 men (group 1)and 40 women (group 2)were asked if they thought sexual discrimination is a problem in the United States.Of those sampled,11 of the men and 19 of the women did believe that sexual discrimination is a problem.Construct a 90% confidence interval estimate of the difference between the proportion of men and women who believe that sexual discrimination is a problem.
(Short Answer)
4.7/5 (39)
TABLE 10-14
The use of preservatives by food processors has become a controversial issue.Suppose two preservatives are extensively tested and determined safe for use in meats.A processor wants to compare the preservatives for their effects on retarding spoilage.Suppose 15 cuts of fresh meat are treated with preservative I and 15 are treated with preservative II,and the number of hours until spoilage begins is recorded for each of the 30 cuts of meat.The results are summarized in the table below. 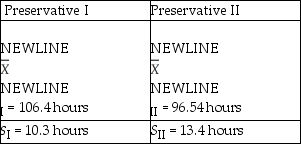 -Referring to Table 10-14,suppose α = 0.05.Which of the following represents the correct conclusion?
(Multiple Choice)
4.7/5 (32)
In testing for the differences between the means of 2 independent populations where the variances in each population are unknown but assumed equal,the degrees of freedom are
(Multiple Choice)
4.9/5 (32)
TABLE 10-15
The table below presents the summary statistics for the starting annual salaries (in thousands of dollars)for individuals entering the public accounting and financial planning professions.
Sample I (public accounting): 1 = 60.35,S1 = 3.25,n1 = 12
Sample II (financial planning): 2 = 58.20,S2 = 2.48,n2 = 14
Test whether the mean starting annual salaries for individuals entering the public accounting professions is higher than that of financial planning assuming that the two population variances are the same.
-Referring to Table 10-15,what is the value of the test statistic?
(Short Answer)
4.9/5 (30)
TABLE 10-3
A real estate company is interested in testing whether the mean time that families in Gotham have been living in their current homes is less than families in Metropolis.Assume that the two population variances are equal.A random sample of 100 families from Gotham and a random sample of 150 families in Metropolis yield the following data on length of residence in current homes.
Gotham: G = 35 months, = 900 Metropolis: M = 50 months, = 1050
-Referring to Table 10-3,suppose α = 0.10.Which of the following represents the result of the relevant hypothesis test?
(Multiple Choice)
4.9/5 (36)
TABLE 10-11
The dean of a college is interested in the proportion of graduates from his college who have a job offer on graduation day.He is particularly interested in seeing if there is a difference in this proportion for accounting and economics majors.In a random sample of 100 of each type of major at graduation,he found that 65 accounting majors and 52 economics majors had job offers.If the accounting majors are designated as "Group 1" and the economics majors are designated as "Group 2," perform the appropriate hypothesis test using a level of significance of 0.05.
-Referring to Table 10-11,construct a 95% confidence interval estimate of the difference in proportion between accounting majors and economic majors who have a job offer on graduation day.
(Short Answer)
4.7/5 (36)
TABLE 10-1
Are Japanese managers more motivated than American managers? A randomly selected group of each were administered the Sarnoff Survey of Attitudes Toward Life (SSATL),which measures motivation for upward mobility.The SSATL scores are summarized below. 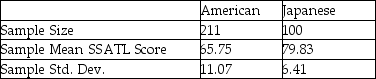 -Referring to Table 10-1,what is the value of the test statistic?
(Multiple Choice)
4.9/5 (27)
TABLE 10-4
Two samples each of size 25 are taken from independent populations assumed to be normally distributed with equal variances.The first sample has a mean of 35.5 and standard deviation of 3.0 while the second sample has a mean of 33.0 and standard deviation of 4.0.
-Referring to Table 10-4,if you were interested in testing against the one-tail alternative that μ1 > μ2 at the α = 0.01 level of significance,the null hypothesis would ________ (be rejected/not be rejected).
(Short Answer)
4.9/5 (37)
Filters
- Essay(0)
- Multiple Choice(0)
- Short Answer(0)
- True False(0)
- Matching(0)