Exam 13: Linear Regression and Correlation
Exam 1: What Is Statistics79 Questions
Exam 2: Describing Data: Frequency Distributions and Graphic Presentations81 Questions
Exam 3: Describing Data: Numerical Measures115 Questions
Exam 4: Describing Data: Displaying and Exploring Data85 Questions
Exam 5: A Survey of Probability Concepts106 Questions
Exam 6: Discrete Probability Distributions94 Questions
Exam 7: Continuous Probability Distributions90 Questions
Exam 8: Sampling Methods and the Central Limit Theorem92 Questions
Exam 9: Estimation and Confidence Intervals94 Questions
Exam 10: One-Sample Tests of Hypothesis140 Questions
Exam 11: Two-Sample Tests of Hypothesis77 Questions
Exam 12: Analysis of Variance94 Questions
Exam 13: Linear Regression and Correlation135 Questions
Exam 14: Multiple Regression and Correlation Analysis125 Questions
Exam 15: Chi-Square Applications101 Questions
Select questions type
A random sample of 15 homes that recently sold is obtained.The correlation between the area of the home,in square feet,and the selling price is 0.40.We want to test the null hypothesis that the correlation in the population is less than or equal to zero versus the alternate that it is greater than zero.The rejection region will fall in the ________ tail of a t distribution.
(Short Answer)
4.8/5  (28)
(28)
Trying to predict weekly sales with a standard error of estimate of $1,955,we would conclude that 68 percent of the predictions would not be off more than $1,955,95 percent would not be off by more $3,910,and 99.7 percent would not be off by more than $5,865.
(True/False)
4.8/5 (39)
How is the coefficient of determination related to the correlation coefficient? ________
(Short Answer)
4.8/5 (32)
The least squares principle is used to determine the best-fitting line.
(True/False)
4.8/5 (41)
If the coefficient of correlation is -0.90,the coefficient of determination is -0.81.
(True/False)
4.9/5 (36)
Pearson's coefficient of correlation can be used if the data is nominally scaled.
(True/False)
4.9/5 (37)
If the value of r is -0.96,what does this indicate about the dependent variable as the independent variable increases? ___________
(Short Answer)
4.8/5 (32)
The regression equation is used to estimate a value of the dependent variable Y based on a selected value of the independent variable X.
(True/False)
4.8/5 (30)
Which of the following is true about the standard error of estimate?
(Multiple Choice)
4.9/5 (30)
If we are studying the relationship between high school grade point average (GPA)and college GPA,and want to predict college GPA,what kind of variable is high school GPA? ________________
(Short Answer)
4.8/5 (23)
If the correlation between two variables is close to one,the association is
(Multiple Choice)
4.9/5 (42)
A regression equation is a mathematical equation that defines the relationship between two variables.
(True/False)
4.9/5 (32)
If the dependent variable is in dollars,the standard error is in what units? ______________
(Short Answer)
4.9/5 (27)
A mathematical transformation can be used to change a curvilinear relationship between two variables to a linear relationship.
(True/False)
4.8/5 (42)
In regression analysis,we expect prediction error or (  - Y)does not equal zero.
(True/False)
4.8/5 (35)
An economist is interested in predicting the unemployment rate based on gross domestic product.Since the economist is interested in predicting unemployment,the independent variable is gross domestic product.
(True/False)
4.8/5 (43)
When testing the strength of the relationship between two variables,the null hypothesis is: 
(True/False)
4.8/5 (29)
A chart that shows the relationship between a dependent variable and an independent variable is called a _______________________.
(Short Answer)
5.0/5 (44)
A sales manager for an advertising agency believes there is a relationship between the number of contacts and the amount of the sales.To verify this belief,the following data was collected: 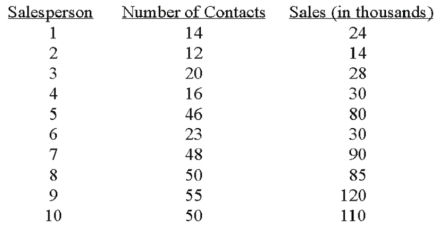 The 95% confidence interval for 30 calls is
(Multiple Choice)
4.8/5 (29)
Which of the following is NOT a difference between a confidence interval and a prediction interval?
(Multiple Choice)
4.8/5 (26)
Filters
- Essay(0)
- Multiple Choice(0)
- Short Answer(0)
- True False(0)
- Matching(0)