Exam 13: Linear Regression and Correlation
Exam 1: What Is Statistics79 Questions
Exam 2: Describing Data: Frequency Distributions and Graphic Presentations81 Questions
Exam 3: Describing Data: Numerical Measures115 Questions
Exam 4: Describing Data: Displaying and Exploring Data85 Questions
Exam 5: A Survey of Probability Concepts106 Questions
Exam 6: Discrete Probability Distributions94 Questions
Exam 7: Continuous Probability Distributions90 Questions
Exam 8: Sampling Methods and the Central Limit Theorem92 Questions
Exam 9: Estimation and Confidence Intervals94 Questions
Exam 10: One-Sample Tests of Hypothesis140 Questions
Exam 11: Two-Sample Tests of Hypothesis77 Questions
Exam 12: Analysis of Variance94 Questions
Exam 13: Linear Regression and Correlation135 Questions
Exam 14: Multiple Regression and Correlation Analysis125 Questions
Exam 15: Chi-Square Applications101 Questions
Select questions type
What is the correlation coefficient developed by Karl Pearson formally known as? ____________________________________
(Short Answer)
4.8/5  (30)
(30)
In plotting paired data in a scatter diagram,the dependent variable scaled on the ___________________
(Short Answer)
4.9/5 (26)
A company wants to study the relationship between an employee's length of employment and their number of workdays absent.The company collected the following information on a random sample of seven employees.  What is the dependent variable (Y)? _____________________
(Short Answer)
4.8/5 (36)
To test the significance of Pearson's r,we use the standard normal z distribution.
(True/False)
4.8/5 (28)
A t test is used to test the significance of the coefficient of correlation.
(True/False)
4.8/5 (34)
A company wants to study the relationship between an employee's length of employment and their number of workdays absent.The company collected the following information on a random sample of seven employees.  What is the meaning of a negative slope? _________________________
(Short Answer)
4.8/5 (25)
A company wants to study the relationship between an employee's length of employment and their number of workdays absent.The company collected the following information on a random sample of seven employees.
(Short Answer)
4.8/5 (28)
A sales manager for an advertising agency believes there is a relationship between the number of contacts and the amount of the sales.To verify this belief,the following data was collected: 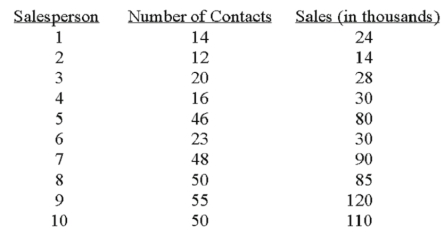 What is the value of the coefficient of correlation?
(Multiple Choice)
4.8/5 (37)
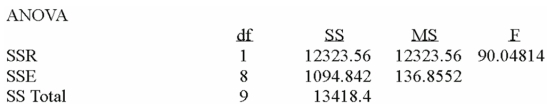
Using the following information: 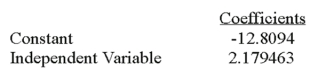
 The regression equation is:
(Multiple Choice)
4.8/5 (32)
A scatter diagram is a graph that portrays the correlation between a dependent variable and an independent variable.
(True/False)
4.7/5 (30)
How does the prediction interval for an individual value of Y compare to the confidence interval for the mean value of Y? _______________
(Short Answer)
4.7/5 (29)
What is the variable used to predict another variable called?
(Multiple Choice)
4.7/5 (30)
How do we designate the sample coefficient of correlation? _____
(Short Answer)
4.8/5 (36)
The coefficient of correlation,r,is often referred to as Spearman's rho.
(True/False)
4.7/5 (30)
In the least squares equation,  = 10 + 20X the value of 20 indicates
(Multiple Choice)
4.9/5 (39)
A confidence interval can be determined for the mean value of Y for a given value of X.
(True/False)
4.7/5 (38)
In a regression analysis every value of y is converted to z with the following formula: z = log(y).What is the conversion called? _______
(Short Answer)
4.9/5 (35)
In order to visualize the regression equation line,we can draw a scatter diagram.
(True/False)
4.8/5 (34)
A sales manager for an advertising agency believes there is a relationship between the number of contacts and the amount of the sales.To verify this belief,the following data was collected: 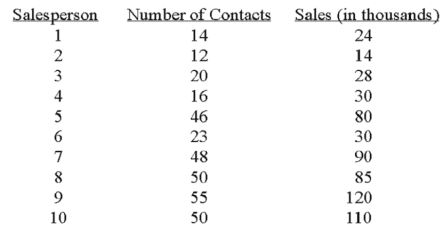 What is the regression equation?
(Multiple Choice)
4.8/5 (35)
Using the following information: 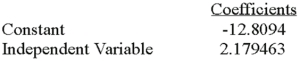
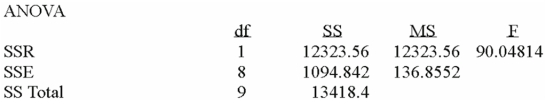 What is the standard error of the estimate?
(Multiple Choice)
4.8/5 (34)
Filters
- Essay(0)
- Multiple Choice(0)
- Short Answer(0)
- True False(0)
- Matching(0)