Exam 2: Describing Data: Frequency Distributions and Graphic Presentations
Exam 1: What Is Statistics79 Questions
Exam 2: Describing Data: Frequency Distributions and Graphic Presentations81 Questions
Exam 3: Describing Data: Numerical Measures115 Questions
Exam 4: Describing Data: Displaying and Exploring Data85 Questions
Exam 5: A Survey of Probability Concepts106 Questions
Exam 6: Discrete Probability Distributions94 Questions
Exam 7: Continuous Probability Distributions90 Questions
Exam 8: Sampling Methods and the Central Limit Theorem92 Questions
Exam 9: Estimation and Confidence Intervals94 Questions
Exam 10: One-Sample Tests of Hypothesis140 Questions
Exam 11: Two-Sample Tests of Hypothesis77 Questions
Exam 12: Analysis of Variance94 Questions
Exam 13: Linear Regression and Correlation135 Questions
Exam 14: Multiple Regression and Correlation Analysis125 Questions
Exam 15: Chi-Square Applications101 Questions
Select questions type
Refer to the following wage breakdown for a garment factory. 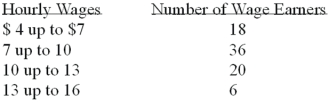 What is the class interval for the table of wages above?
(Multiple Choice)
4.7/5  (37)
(37)
Refer to the following information from a frequency distribution for "heights of college women" recorded to the nearest inch: The first two class midpoints are 62.5" and 65.5".
What are the class limits for the lowest class?
(Multiple Choice)
4.9/5 (35)
For a frequency distribution of qualitative data,if the observations can be assigned to only one class,the classes are ____________________________.
(Short Answer)
4.9/5 (38)
Refer to the following frequency distribution on days absent during a calendar year by employees of a manufacturing company: 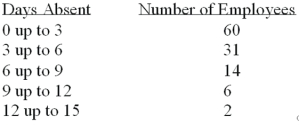 How many employees were absent from 6 up to 12 days?
(Multiple Choice)
4.7/5 (36)
In general,we should construct a frequency distribution so that there are either 4 or 24 classes.
(True/False)
4.9/5 (37)
Refer to the following breakdown of responses to a survey of room cleanliness in a hotel. 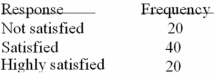 What is the class interval for the frequency table above?
(Multiple Choice)
4.8/5 (25)
Refer to the following wage breakdown for a garment factory. 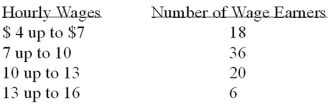 What is the class midpoint for the class with the greatest frequency?
(Multiple Choice)
4.9/5 (29)
The height of a bar in a histogram represents the number of observations for a class.
(True/False)
4.9/5 (36)
Refer to the following breakdown of responses to a survey of room cleanliness in a hotel. 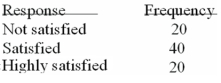 What percent of the responses indicated that customers were satisfied?
(Multiple Choice)
4.8/5 (39)
Refer to the following breakdown of responses to a survey of room cleanliness in a hotel. 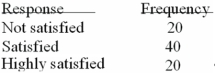 What is the class with the greatest frequency?
(Multiple Choice)
4.8/5 (35)
Monthly commissions of first-year insurance brokers are $1,270,$1,310,$1,680,$1,380,$1,410,$1,570,$1,180 and $1,420.These figures are referred to as:
(Multiple Choice)
4.8/5 (32)
Refer to the following distribution of commissions: 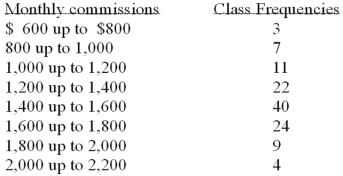 What is the relative frequency for those salespersons that earn from $1,600 up to $1,800?
(Multiple Choice)
4.9/5 (29)
Refer to the following distribution: 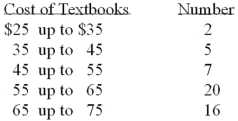 What is the relative class frequency for the $25 up to $35 class?
(Multiple Choice)
4.9/5 (40)
The monthly salaries of a sample of 100 employees were rounded to the nearest ten dollars.They ranged from a low of $1,040 to a high of $1,720.If we want to condense the data into seven classes,what is the most convenient class interval?
(Multiple Choice)
4.9/5 (36)
For a frequency distribution of quantitative data,if every individual,object or measurement can be assigned to a class,the frequency distribution is ____________.
(Short Answer)
4.8/5 (36)
A frequency distribution for quantitative data has class limits.
(True/False)
4.9/5 (38)
Refer to the following class marks or midpoints for a frequency distribution of "weights of college men" recorded to the nearest pound:
The first three class marks are 105,115,and 125.
What is the upper limit for the third class? _______
(Short Answer)
4.8/5 (37)
To construct a histogram,the class frequencies are plotted on the vertical or Y-axis and either the stated limits,the true limits or the midpoints are plotted on the horizontal or X-axis.
(True/False)
4.7/5 (41)
When constructing a frequency distribution,try to include overlapping stated class limits,such as 100 up to 201,200 up to 301,and 300 up to 401.
(True/False)
4.9/5 (35)
Filters
- Essay(0)
- Multiple Choice(0)
- Short Answer(0)
- True False(0)
- Matching(0)