Exam 2: Describing Data: Frequency Distributions and Graphic Presentations
Exam 1: What Is Statistics79 Questions
Exam 2: Describing Data: Frequency Distributions and Graphic Presentations81 Questions
Exam 3: Describing Data: Numerical Measures115 Questions
Exam 4: Describing Data: Displaying and Exploring Data85 Questions
Exam 5: A Survey of Probability Concepts106 Questions
Exam 6: Discrete Probability Distributions94 Questions
Exam 7: Continuous Probability Distributions90 Questions
Exam 8: Sampling Methods and the Central Limit Theorem92 Questions
Exam 9: Estimation and Confidence Intervals94 Questions
Exam 10: One-Sample Tests of Hypothesis140 Questions
Exam 11: Two-Sample Tests of Hypothesis77 Questions
Exam 12: Analysis of Variance94 Questions
Exam 13: Linear Regression and Correlation135 Questions
Exam 14: Multiple Regression and Correlation Analysis125 Questions
Exam 15: Chi-Square Applications101 Questions
Select questions type
A relative frequency distribution shows the number of observations in each class.
(True/False)
4.9/5  (37)
(37)
For quantitative data,the relative frequency for a class is computed as the
(Multiple Choice)
4.8/5 (35)
Refer to the following information from a frequency distribution for "heights of college women" recorded to the nearest inch: The first two class midpoints are 62.5" and 65.5".
What are the class limits for the third class?
(Multiple Choice)
4.9/5 (35)
Refer to the following distribution of commissions: 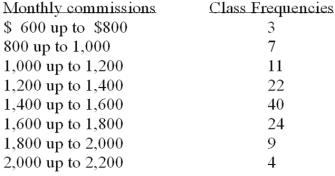 What is the class interval?
(Multiple Choice)
4.7/5 (44)
A frequency distribution for qualitative data shows the number of observations in each class.
(True/False)
4.8/5 (31)
For qualitative data,the relative frequency for a class is computed as the
(Multiple Choice)
4.9/5 (45)
Refer to the following information from a frequency distribution for "heights of college women" recorded to the nearest inch: The first two class midpoints are 62.5" and 65.5".
What is the class interval?
(Multiple Choice)
4.7/5 (35)
A cumulative frequency distribution is used when we want to determine how many observations lie above or below certain values.
(True/False)
4.8/5 (31)
To summarize the gender of students attending a college,a frequency distribution groups data into two classes.
(True/False)
4.9/5 (31)
When data is collected using a qualitative,nominal variable,i.e. ,male or female,what is true about a frequency distribution that summarizes the data?
(Multiple Choice)
4.9/5 (35)
To convert a frequency distribution to a relative frequency distribution,divide each class frequency by the sum of the class frequencies.
(True/False)
4.8/5 (32)
A sample distribution of hourly earnings in Paul's Cookie Factory is:  The limits of the class with the smallest frequency are:
(Multiple Choice)
4.9/5 (40)
Refer to the following distribution of commissions: 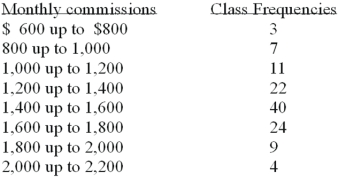 The first plot for a cumulative frequency distribution would be:
(Multiple Choice)
4.9/5 (33)
Why are unequal class intervals sometimes used in a frequency distribution?
(Multiple Choice)
4.7/5 (25)
To summarize the gender of students attending a college,the number of classes in a frequency distribution depends on the number of students.
(True/False)
4.9/5 (33)
A student was studying the political party preferences of a university's student population.The survey instrument asked students to identify themselves as a democrat or a republican.This question is flawed because:
(Multiple Choice)
4.9/5 (31)
When data is collected using a quantitative,ratio variable,what is true about a frequency distribution that summarizes the data?
(Multiple Choice)
4.9/5 (46)
Refer to the following distribution of ages: 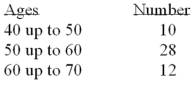 What is the class interval?
(Multiple Choice)
4.8/5 (32)
Filters
- Essay(0)
- Multiple Choice(0)
- Short Answer(0)
- True False(0)
- Matching(0)