Exam 4: Elasticity
Exam 1: What Is Economics198 Questions
Exam 2: The Economic Problem143 Questions
Exam 3: Demand and Supply178 Questions
Exam 4: Elasticity168 Questions
Exam 5: Efficiency and Equity110 Questions
Exam 6: Government Actions in Markets119 Questions
Exam 7: Global Markets in Action129 Questions
Exam 8: Utility and Demand110 Questions
Exam 9: Possibilities,preferences,and Choices113 Questions
Exam 10: Organizing Production104 Questions
Exam 11: Output and Costs133 Questions
Exam 12: Perfect Competition118 Questions
Exam 13: Monopoly107 Questions
Exam 14: Monopolistic Competition111 Questions
Exam 15: Oligopoly97 Questions
Exam 16: Externalities111 Questions
Exam 17: Public Goods and Common Resources89 Questions
Exam 18: Markets for Factors of Production119 Questions
Exam 19: Economic Inequality117 Questions
Select questions type
Use the table below to answer the following questions.
Table 4.1.1
Demand schedule for good A.
Price (dollars per unit) Quantity demanded (units) 9.00 0 8.00 2,000 7.00 4,000 6.00 6,000 5.00 8,000 4.00 10,000 3.00 12,000 2.00 14,000 1.00 16,000 0 18,000
-Refer to Table 4.1.1.Demand is unit elastic when the price falls from
(Multiple Choice)
4.9/5  (34)
(34)
If a large percentage drop in the price level results in a small percentage increase in the quantity demanded,
(Multiple Choice)
4.7/5 (39)
If a rise in the price of good B increases the demand for good A,then
(Multiple Choice)
4.9/5 (40)
Tina and Brian work for the same recording company.Tina claims they would be better off by raising the price of their CDs,while Brian claims they would be better off by lowering the price.We can conclude that
(Multiple Choice)
4.8/5 (35)
Suppose your annual income is $65 000 and your favourite TV Guide magazine costs you $28 a year.Your demand for the TV Guide magazine is likely to be
(Multiple Choice)
4.8/5 (32)
Use the table below to answer the following question.
Table 4.1.2
Price Quantity per Volleyball Demanded \ 19 55 \ 21 45
-Refer to Table 4.1.2.The table shows two points on the demand curve for volleyballs.What is the price elasticity of demand between these two points?
(Multiple Choice)
4.8/5 (27)
Suppose a rise of 8 percent in the price of bison meat in Saskatchewan reduces the consumption of bison meat by 24 percent.Such a price rise will induce consumers to spend
(Multiple Choice)
4.9/5 (40)
The elasticity of supply is a units-free measure of the responsiveness of the
(Multiple Choice)
4.8/5 (44)
If a rise in price results in a decrease in total revenue,then the price elasticity of demand is
(Multiple Choice)
4.8/5 (33)
If price elasticity of demand is zero,then as the price falls
(Multiple Choice)
4.9/5 (36)
Use the table below to answer the following questions.
Table 4.1.1
Demand schedule for good A.
Price (dollars per unit) Quantity demanded (units) 9.00 0 8.00 2,000 7.00 4,000 6.00 6,000 5.00 8,000 4.00 10,000 3.00 12,000 2.00 14,000 1.00 16,000 0 18,000
-Refer to Table 4.1.1.If the price of good A falls from $4 to $3,
(Multiple Choice)
4.8/5 (30)
As a result of a poor growing season,the supply curve of apples shifted leftward,the equilibrium price of apples rose,and total revenue fell.This suggests that the price elasticity of demand for apples is
(Multiple Choice)
4.8/5 (37)
The concept used by economists to indicate the responsiveness of the quantity demanded of a good to a change in its price is the
(Multiple Choice)
4.8/5 (32)
Use the table below to answer the following question.
Table 4.1.4
Price (dollars per chip) Quantity Demanded (millions of chips per year) 200 50 250 45 300 40 350 35 400 30
-Refer to Table 4.1.4.The table shows the demand schedule for computer chips.As the price rises from $200 a chip to $300 a chip,total revenue ________.So at a price of $250 a chip,demand is ________.
(Multiple Choice)
4.8/5 (36)
Use the figure below to answer the following question.
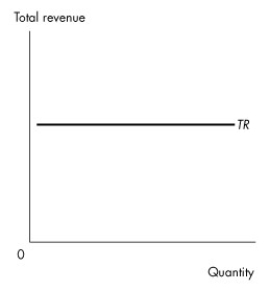 Figure 4.1.3
-Given the relationship shown in Figure 4.1.3 between total revenue from the sale of a good and the quantity of the good sold,then
Figure 4.1.3
-Given the relationship shown in Figure 4.1.3 between total revenue from the sale of a good and the quantity of the good sold,then
(Multiple Choice)
4.9/5 (40)
When the price elasticity of demand is ________,demand for the good is elastic.
(Multiple Choice)
4.9/5 (41)
Use the figure below to answer the following question.
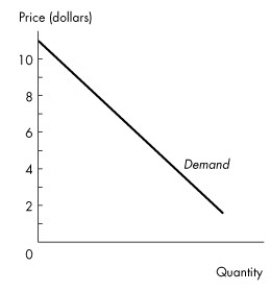 Figure 4.1.1
-Figure 4.1.1 illustrates a linear demand curve.Comparing the price elasticity in the $2 to $3 price range with the elasticity in the $8 to $9 range,we can conclude
Figure 4.1.1
-Figure 4.1.1 illustrates a linear demand curve.Comparing the price elasticity in the $2 to $3 price range with the elasticity in the $8 to $9 range,we can conclude
(Multiple Choice)
4.9/5 (38)
Filters
- Essay(0)
- Multiple Choice(0)
- Short Answer(0)
- True False(0)
- Matching(0)