Exam 12: Chi-Square Tests and Nonparametric Tests
Exam 1: Instruction and Data Collection47 Questions
Exam 2: Presenting Data in Tables and Charts277 Questions
Exam 3: Numerical Descriptive Measures139 Questions
Exam 4: Basic Probability137 Questions
Exam 5: Some Important Discrete Probability Distributions188 Questions
Exam 6: The Normal Distribution and Other Continuous Distributions164 Questions
Exam 7: Sampling and Sampling Distributions187 Questions
Exam 8: Confidence Interval Estimation173 Questions
Exam 9: Fundamentals of Hypothesis Testing: One-Sample Tests146 Questions
Exam 10: Two-Sample Tests190 Questions
Exam 11: Analysis of Variance127 Questions
Exam 12: Chi-Square Tests and Nonparametric Tests174 Questions
Exam 13: Simple Linear Regression198 Questions
Exam 14: Introduction to Multiple Regression215 Questions
Exam 15: Multiple Regression Model Building101 Questions
Exam 16: Time-Series Analysis and Index Numbers133 Questions
Exam 17: Statistical Applications in Quality Management132 Questions
Exam 18: Data Analysis Overview52 Questions
Select questions type
TABLE 12-3
A computer used by a 24-hour banking service is supposed to randomly assign each transaction to one of 5 memory locations. A check at the end of a day's transactions gave the counts shown in the table to each of the 5 memory locations, along with the number of reported errors.
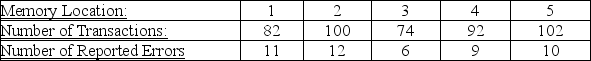 The bank manager wanted to test whether the proportion of errors in transactions assigned to each of the 5 memory locations differ.
-Referring to Table 12-3, the degrees of freedom of the test statistic is
The bank manager wanted to test whether the proportion of errors in transactions assigned to each of the 5 memory locations differ.
-Referring to Table 12-3, the degrees of freedom of the test statistic is
(Multiple Choice)
4.8/5  (29)
(29)
TABLE 12-15
The director of the MBA program of a state university wanted to know if a one week orientation would change the proportion among potential incoming students who would perceive the program as being good. Given below is the result from 215 students' view of the program before and after the orientation.
 -Referring to Table 12-15, the director should reject the null hypothesis using a 1% level of significance.
(True/False)
4.9/5 (33)
TABLE 12-11
Parents complain that children read too few storybooks and watch too much television nowadays. A survey of 1,000 children reveals the following information on average time spent watching TV and average time spent reading storybooks
 -Referring to Table 12-11, we want to test whether there is any relationship between average time spent watching TV and average time spent reading storybooks. Suppose the value of the test statistic was 164 (which is not the correct answer) and the critical value was 19.00 (which is not the correct answer), then we could conclude that
(Multiple Choice)
4.9/5 (41)
When using the χ2 tests for independence, one should be aware that expected frequencies that are too small will lead to too big a type I error.
(True/False)
4.7/5 (29)
TABLE 12-16
As part of an evaluation program, a sporting goods retailer wanted to compare the downhill coasting speeds of 4 brands of bicycles. She took 3 of each brand and determined their maximum downhill speeds. The results are presented in miles per hour in the table below.
 -Referring to Table 12-16, the calculation of the Kruskal-Wallis test statistic H involves obtaining the total of the ranks for each sample. These totals are ________, ________, ________, and ________.
(Short Answer)
4.9/5 (19)
The Journal of Business Venturing reported on the activities of entrepreneurs during the organization creation process. As part of a designed study, a total of 71 entrepreneurs were interviewed and divided into 3 groups: those that were successful in founding a new firm (n1 = 34), those still actively trying to establish a firm (n2 = 21), and those who tried to start a new firm but eventually gave up (n3 = 16). The total number of activities undertaken (e.g., developed a business plan, sought funding, looked for facilities) by each group over a specified time period during organization creation was measured. The objective is to compare the mean number of activities of the 3 groups of entrepreneurs. Because of concerns over necessary assumption of the parametric analysis, it was decided to use a nonparametric analysis. Identify the nonparametric method that would be used to analyze the data..
(Multiple Choice)
4.8/5 (31)
TABLE 12-9
Four surgical procedures currently are used to install pacemakers. If the patient does not need to return for follow-up surgery, the operation is called a "clear" operation. A heart center wants to compare the proportion of clear operations for the 4 procedures, and collects the following numbers of patients from their own records:
 They will use this information to test for a difference among the proportion of clear operations using a chi-square test with a level of significance of 0.05.
-Referring to Table 12-9, the null hypothesis will be rejected.
They will use this information to test for a difference among the proportion of clear operations using a chi-square test with a level of significance of 0.05.
-Referring to Table 12-9, the null hypothesis will be rejected.
(True/False)
4.8/5 (32)
TABLE 12-4
One criterion used to evaluate employees in the assembly section of a large factory is the number of defective pieces per 1,000 parts produced. The quality control department wants to find out whether there is a relationship between years of experience and defect rate. Since the job is repetitious, after the initial training period any improvement due to a learning effect might be offset by a loss of motivation. A defect rate is calculated for each worker in a yearly evaluation. The results for 100 workers are given in the table below.
 -Referring to Table 12-4, what is the expected number of employees with 1 to 4 years of training time and a high defect rate?
(Multiple Choice)
5.0/5 (33)
TABLE 12-7
The director of transportation of a large company is interested in the usage of her van pool. She considers her routes to be divided into local and non-local. She is particularly interested in learning if there is a difference in the proportion of males and females who use the local routes. She takes a sample of a day's riders and finds the following:
 She will use this information to perform a chi-square hypothesis test using a level of significance of 0.05.
-Referring to Table 12-7, the null hypothesis will be rejected.
She will use this information to perform a chi-square hypothesis test using a level of significance of 0.05.
-Referring to Table 12-7, the null hypothesis will be rejected.
(True/False)
4.9/5 (32)
TABLE 12-16
As part of an evaluation program, a sporting goods retailer wanted to compare the downhill coasting speeds of 4 brands of bicycles. She took 3 of each brand and determined their maximum downhill speeds. The results are presented in miles per hour in the table below.
-Referring to Table 12-16, the alternative hypothesis of the Kruskal-Wallis test is that ________.
(Short Answer)
5.0/5 (39)
TABLE 12-8
The director of transportation of a large company is interested in the usage of the company's van pool program. She surveyed 129 of her employees on the usage of the program before and after a campaign to convince her employees to use the service and obtained the following:
 She will use this information to perform test using a level of significance of 0.05.
-Referring to Table 12-8, the director now wants to know if the proportion of employees who use the service before the campaign and the proportion of employees who use the service after the campaign are the same. What should be her conclusion?
She will use this information to perform test using a level of significance of 0.05.
-Referring to Table 12-8, the director now wants to know if the proportion of employees who use the service before the campaign and the proportion of employees who use the service after the campaign are the same. What should be her conclusion?
(Multiple Choice)
4.8/5 (32)
TABLE 12-7
The director of transportation of a large company is interested in the usage of her van pool. She considers her routes to be divided into local and non-local. She is particularly interested in learning if there is a difference in the proportion of males and females who use the local routes. She takes a sample of a day's riders and finds the following:
She will use this information to perform a chi-square hypothesis test using a level of significance of 0.05.
-Referring to Table 12-7, the expected cell frequency in the Female/Non-Local cell is ________.
(Short Answer)
4.8/5 (42)
The McNemar test is used to determine whether there is evidence of a difference between the proportions of two related samples.
(True/False)
4.9/5 (38)
TABLE 12-6
The dean of a college is interested in the proportion of graduates from his college who have a job offer on graduation day. He is particularly interested in seeing if there is a difference in this proportion for accounting and economics majors. In a random sample of 100 of each type of major at graduation, he found that 65 accounting majors and 52 economics majors had job offers. If the accounting majors are designated as "Group 1" and the economics majors are designated as "Group 2," perform the appropriate hypothesis test using a level of significance of 0.05.
-Referring to Table 12-6, the hypotheses the dean should use are:
(Multiple Choice)
4.9/5 (40)
Filters
- Essay(0)
- Multiple Choice(0)
- Short Answer(0)
- True False(0)
- Matching(0)