Exam 3: Numerical Descriptive Measures
Exam 1: Instruction and Data Collection47 Questions
Exam 2: Presenting Data in Tables and Charts277 Questions
Exam 3: Numerical Descriptive Measures139 Questions
Exam 4: Basic Probability137 Questions
Exam 5: Some Important Discrete Probability Distributions188 Questions
Exam 6: The Normal Distribution and Other Continuous Distributions164 Questions
Exam 7: Sampling and Sampling Distributions187 Questions
Exam 8: Confidence Interval Estimation173 Questions
Exam 9: Fundamentals of Hypothesis Testing: One-Sample Tests146 Questions
Exam 10: Two-Sample Tests190 Questions
Exam 11: Analysis of Variance127 Questions
Exam 12: Chi-Square Tests and Nonparametric Tests174 Questions
Exam 13: Simple Linear Regression198 Questions
Exam 14: Introduction to Multiple Regression215 Questions
Exam 15: Multiple Regression Model Building101 Questions
Exam 16: Time-Series Analysis and Index Numbers133 Questions
Exam 17: Statistical Applications in Quality Management132 Questions
Exam 18: Data Analysis Overview52 Questions
Select questions type
TABLE 3-7
In the 2009-2010 academic year, many public universities in the United States raised tuition and fees due to a decrease in state subsidies. The change in the cost of tuition, a shared dormitory room, and the most popular meal plan from the 2008-2009 academic year for a sample of 10 public universities were as follows: $1589, $593, $1223, $869, $423, $1720, $708, $1425, $922 and $308.
-Referring to Table 3-7, what is the five-number summary of the change in the cost?
(Short Answer)
4.9/5  (22)
(22)
The interquartile range is a measure of variation or dispersion in a set of data.
(True/False)
4.7/5 (37)
The coefficient of variation measures variability in a data set relative to the size of the arithmetic mean.
(True/False)
4.9/5 (26)
You were told that the 1st, 2nd, and 3rd quartiles of students' weight at a major university are 95 lbs, 125 lbs, and 138 lbs. What percentage of the students weigh more than 125 lbs?
(Short Answer)
4.9/5 (32)
TABLE 3-2
The data below represent the amount of grams of carbohydrates in a serving of breakfast cereal in a sample of 11 different servings.
 -Referring to Table 3-2, what type of shape does the distribution of the sample appear to have?
(Short Answer)
4.8/5 (31)
TABLE 3-1
Health care issues are receiving much attention in both academic and political arenas. A sociologist recently conducted a survey of citizens over 60 years of age whose net worth is too high to qualify for Medicaid and have no private health insurance. The ages of 25 uninsured senior citizens were as follows:
 -Referring to Table 3-1, identify the median age of the uninsured senior citizens.
(Short Answer)
4.8/5 (40)
TABLE 3-3
The ordered array below represents the number of vitamin supplements sold by a health food store in a sample of 16 days.
19, 19, 20, 20, 22, 23, 25, 26, 27, 30, 33, 34, 35, 36, 38, 41
Note: For this sample, the sum of the observations is 448, the sum of the squares of the observations is 13,356,
and the sum of the squared differences between each observation and the mean is 812.
-Referring to Table 3-3, the arithmetic mean of the number of vitamin supplements sold in this sample is ________.
(Short Answer)
4.7/5 (35)
TABLE 3-5
The rate of return of a Fortune 500 company over the past 15 years are: 3.17%, 4.43%, 5.93%, 5.43%, 7.29%, 8.21%, 6.23%, 5.23%, 4.34%, 6.68%, 7.14%, -5.56%, -5.23%, -5.73%, -10.34%
-Referring to Table 3-5, compute the arithmetic mean rate of return.
(Short Answer)
4.9/5 (32)
Which descriptive summary measures are considered to be resistant statistics?
(Multiple Choice)
4.8/5 (29)
Which measure of central tendency can be used for both numerical and categorical variables?
(Multiple Choice)
4.9/5 (32)
TABLE 3-3
The ordered array below represents the number of vitamin supplements sold by a health food store in a sample of 16 days.
19, 19, 20, 20, 22, 23, 25, 26, 27, 30, 33, 34, 35, 36, 38, 41
Note: For this sample, the sum of the observations is 448, the sum of the squares of the observations is 13,356,
and the sum of the squared differences between each observation and the mean is 812.
-Referring to Table 3-3, construct a boxplot for the data in this sample.
(Essay)
4.9/5 (38)
TABLE 3-9
The following table represents the assets in billions of dollars of the five largest bond funds.
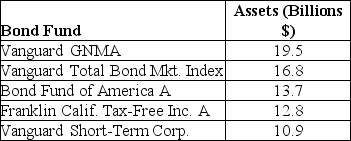 -Referring to Table 3-9, what is the mean for this population of the five largest bond funds?
(Short Answer)
4.8/5 (34)
If the data set is approximately bell-shaped, the empirical rule will more accurately reflect the greater concentration of data close to the mean as compared to the Chebyshev rule.
(True/False)
4.8/5 (28)
The geometric mean is a measure of variation or dispersion in a set of data.
(True/False)
4.8/5 (26)
TABLE 3-1
Health care issues are receiving much attention in both academic and political arenas. A sociologist recently conducted a survey of citizens over 60 years of age whose net worth is too high to qualify for Medicaid and have no private health insurance. The ages of 25 uninsured senior citizens were as follows:
-Referring to Table 3-1, calculate the arithmetic mean age of the uninsured senior citizens to the nearest hundredth of a year.
(Short Answer)
4.9/5 (34)
TABLE 3-8
The time period from 2006 to 2009 saw a great deal of volatility in the value of stocks. The data in the following table represent the total rate of return of our companies from 2006 to 2009.
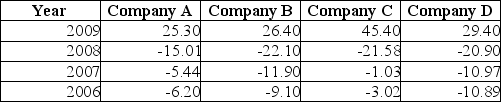 -Referring to Table 3-8, calculate the geometric mean rate of return for Company C.
(Short Answer)
4.9/5 (34)
As a general rule, an observation is considered an extreme value if its Z score is less than -3.
(True/False)
4.9/5 (35)
TABLE 3-2
The data below represent the amount of grams of carbohydrates in a serving of breakfast cereal in a sample of 11 different servings.
-Referring to Table 3-2, the median carbohydrate amount in the cereal is ________ grams.
(Short Answer)
4.8/5 (37)
TABLE 3-4
The ordered array below represents the number of cargo manifests approved by customs inspectors of the Port of New York in a sample of 35 days:
16, 17, 18, 18, 19, 20, 20, 21, 21, 21, 22, 22, 22, 22, 23, 23, 23, 23, 24, 24, 24, 25, 25, 26, 26, 26, 27, 28, 28, 29, 29, 31, 31, 32, 32
Note: For this sample, the sum of the observations is 838, the sum of the squares of the observations is 20,684, and the sum of the squared differences between each observation and the mean is 619.89.
-Referring to Table 3-4, construct a boxplot of this sample.
(Essay)
4.8/5 (26)
Filters
- Essay(0)
- Multiple Choice(0)
- Short Answer(0)
- True False(0)
- Matching(0)